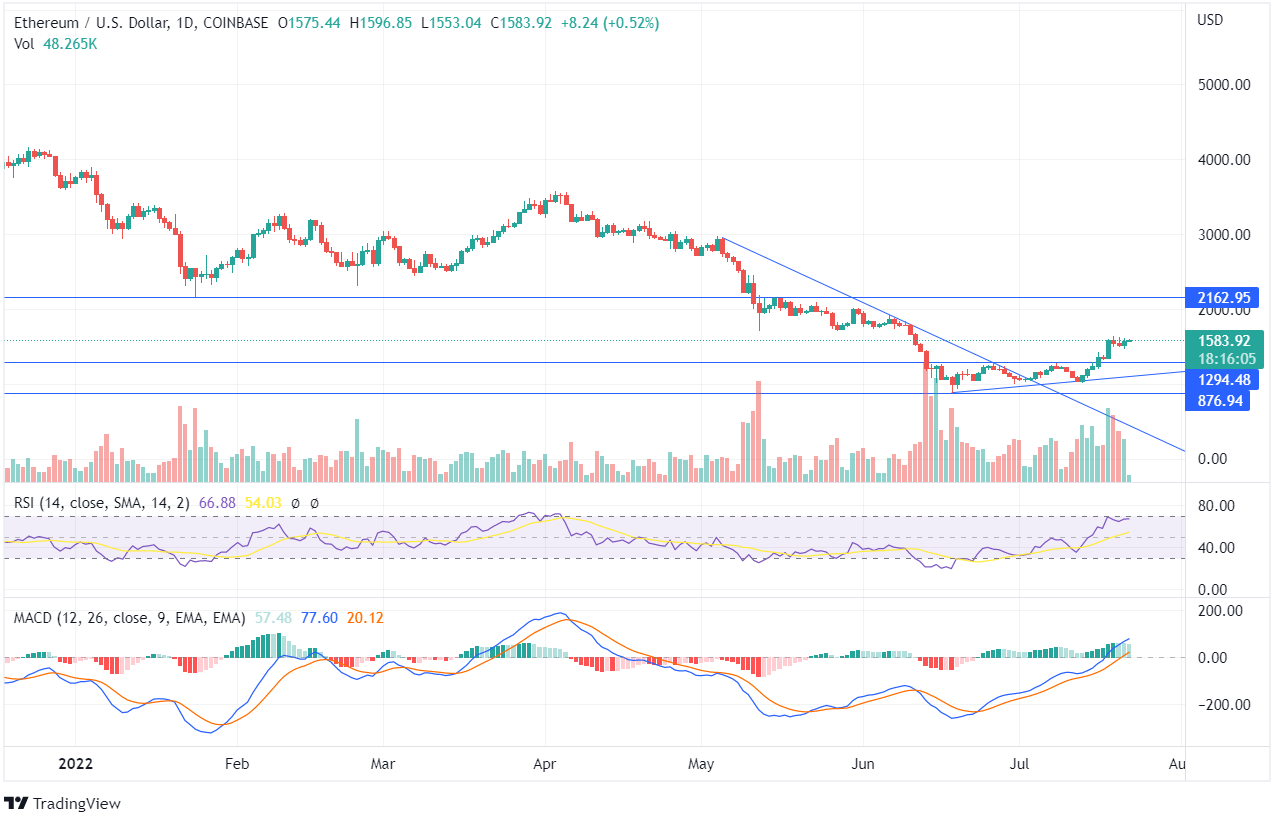
Ethereum (ETH) has recently shown a breakout from the support zone as the price begins to ascend from its lows and is currently moving at the market price of $1583. The coin had constantly been moving down; however, recently, the price began to move upwards, closing above the previous highs and heading towards the resistance zone.
The price took the support of the uptrend line on the daily chart and formed a bullish engulfing pattern. ETH is forming an ascending triangle pattern; the volume has also increased over the last trading days, so the price may surge.
The price of Ethereum has recently turned from the oversold zone and may head toward the overbought zone as the indicator shows heading higher. Read the ETH prediction to find out how high the price of the token can reach!
The MACD line has been ahead of the Signal line for the past few days, and the histogram chart also shows green candles. There has already been a decent hike from when the MACD gave a buy signal. If the bulls continue to put buying pressure, the token may reach its resistance of $2162 in the upcoming days.
On the weekly chart, the Ethereum price was moving sideways in a horizontal channel; however, the previous week’s candle showed a breakout as the price closed above $1294. The weekly candles, closing above the previous high, shows the up-trending market. The previous week’s candle ascended significantly and was a gainful opportunity for the bullish investors.
The technical parameters on the weekly chart are currently neutral; however, the curve of the indicators shows the price may increase in the future. The ETH token turning from the support zone in a longer time frame can be a noticeable opportunity for long-term investors.


