Ethereum, the largest altcoin in the crypto market, is seen nosediving below $600 after trading beyond a week. However, the largest cryptocurrency by market capitalization, Bitcoin is still maintaining its stance above $23k and trading in green even though the major altcoins are dropping and in red.
ETH breaks the gaining streak, and with a bearish falling candle, the coin tests weekly support at $551, after the apparent dip yesterday, it breached the lower Bollinger Band. As per Ethereum price prediction, this dip can be an opportunity for the HODLers to enter and hold as it is the crypto for the long-term.
Just loaded up on a ton of $ETH
These prices are so freaking good longterm
— Cactus (@thecryptocactus) December 23, 2020
Therefore, Ethereum is now falling amidst the risk-free cryptos and is one to balance out the risk appetite of an investor’s portfolio in the long-term, including Bitcoin. The diversification is simple and evens out the risk that an investor against various blue-chip cryptos.
The majority of the people should avoid trading and just hold $BTC and $ETH for the coming years.
— Michaël van de Poppe (@CryptoMichNL) December 24, 2020
However, in the last week, Bitcoin was hitting an All-Time High, but Ethereum restrained from reconciling to its ATH that it had hit in Jan 2018, and within the same duration, Ethereum traded to a 50% lesser value from its ATH. But ETH gained notably after two years of trading sideways.
Ethereum Price Analysis

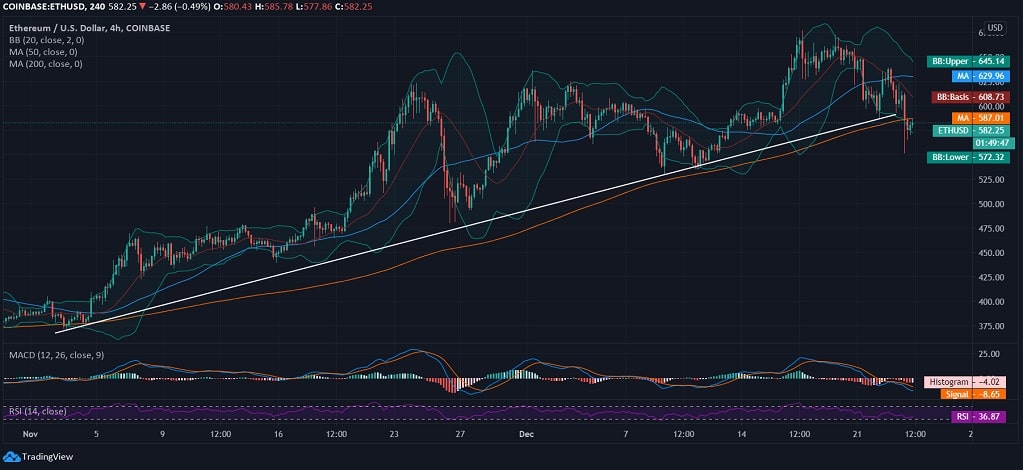
Ethereum, on the above 4-hourly chart, is seen drawing a clear bearish crossover as it trades below $600. However, the price trend of ETH/USD is already breaching the lower 20-day Bollinger Band, but the bands do not reflect any trading extremities, and therefore the dip is determined to stay until a steady blow of traction.
However, if we emphasize on Ethereum chart over the past two months now, the cumulative movement clearly draws a subtle uptrend against the greenback, but with a bearish divergence over the past two days, the coin lost support from 50-day and 200-day 4-hourly MA at $629 and $587, respectively.
The RSI is also holding a strong inclination towards the oversold region and lies at 36.87 as the intraday demand for the crypto slashes with its falling price.

