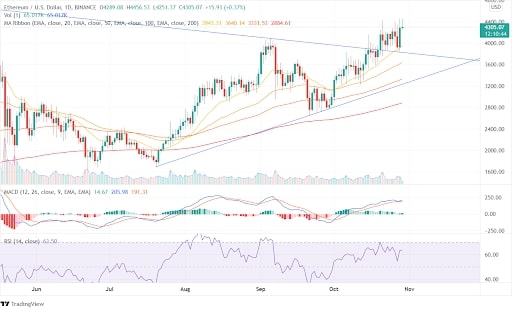
Ethereum is the second-largest cryptocurrency and is expected to outstrip Bitcoin in the upcoming future. The price of the ETH coin is currently $4331, with a trading volume of $24,623,273,078. The coin tumbled drastically in the May to July period and eventually regained its position after mid of July. From the lows of $1692 on July 20, Ethereum is currently prevailing at its highs, anticipating bullish momentum and suppressing the high of $4646.

The RSI being at 60 does not give a specific indication; however, we can expect an up move being optimistic. The MACD indicator shows that the MACD line is above the signal line, thus giving a bullish indication. The support in the daily chart can be around $3402. The formation of a bullish engulfing pattern can be a skillful opportunity for bulls.
From September 27, in the weekly chart, the coin is constantly making higher highs and lower lows following the uptrend line. The MACD is giving a strong buy signal. However, the price got tested in the weekly chart but was unable to go down. The volume is in favor of bulls.
The script is in its rising zone, and the formation of bullish candles is a sign of a bull market. The minimum take profit can be expected to be 10-15%, with a stop loss to $3844.

