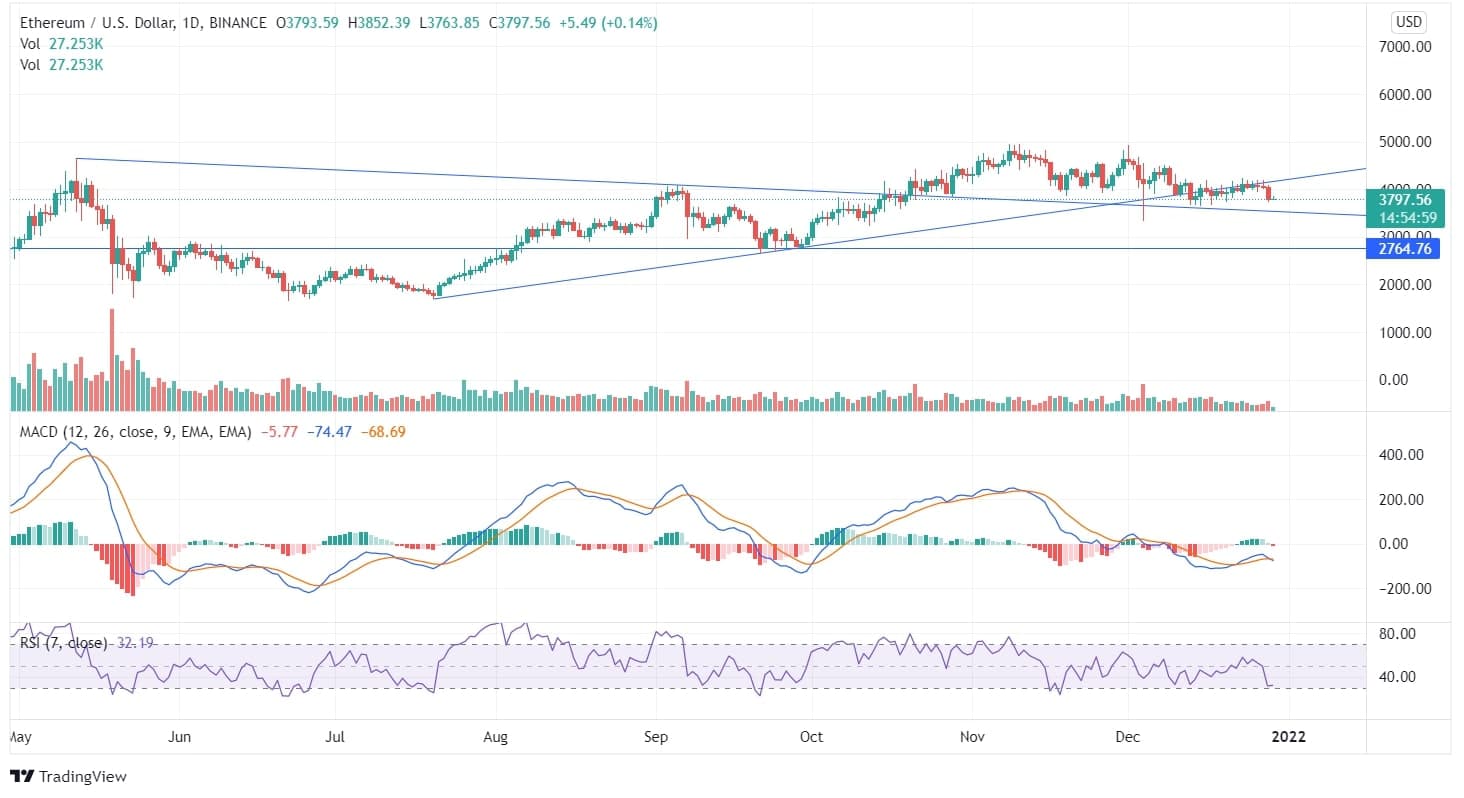
Ethereum (ETH) was at its high of $4951 during mid-November, after which it sloped significantly at the beginning of December. On December 28, the coin gave a slight return to its bears, and ETH is heading towards its downward trend line stretching over from May 21.
If the price closes below the down trend line, it may further fall towards the support line of $2764. ETH has already closed below the uptrend line after moving at the edges of the trend line for a few days. The bears pushed the price down to $3737 after indecision between the bears and the bulls.

The volume indicator also shows remote movement in the candles creating indecisiveness between the bears and the bullish investors. There is a bullish divergence between the price and the RSI, which may be the hope for an uptrend price move. The bulls need to pressure the price in an up-flow direction.
On the weekly chart, the bearish candle formed has closed below the up-trend line. The technical indicators in the long run charts are demonstrating a bearish momentum. If the price continues to decline, it may reach the swing low or the support line. In the current scenario, there is a formation of a bearish engulfing pattern which may be an opportunity for the bearish investors. For detailed insights on Ethereum’s price trajectory, check the Ethereum price prediction.
In the weekly chart as well, there is a bullish divergence formed between the price and the RSI. If the price turns around from this point, an upsurge may be expected.
In the shorter time frame charts, like 4-hourly, the price has constantly fallen, and the price has suppressed the trend line with the continuous formation of bearish candles. The coin is about to touch the robust support zone.

