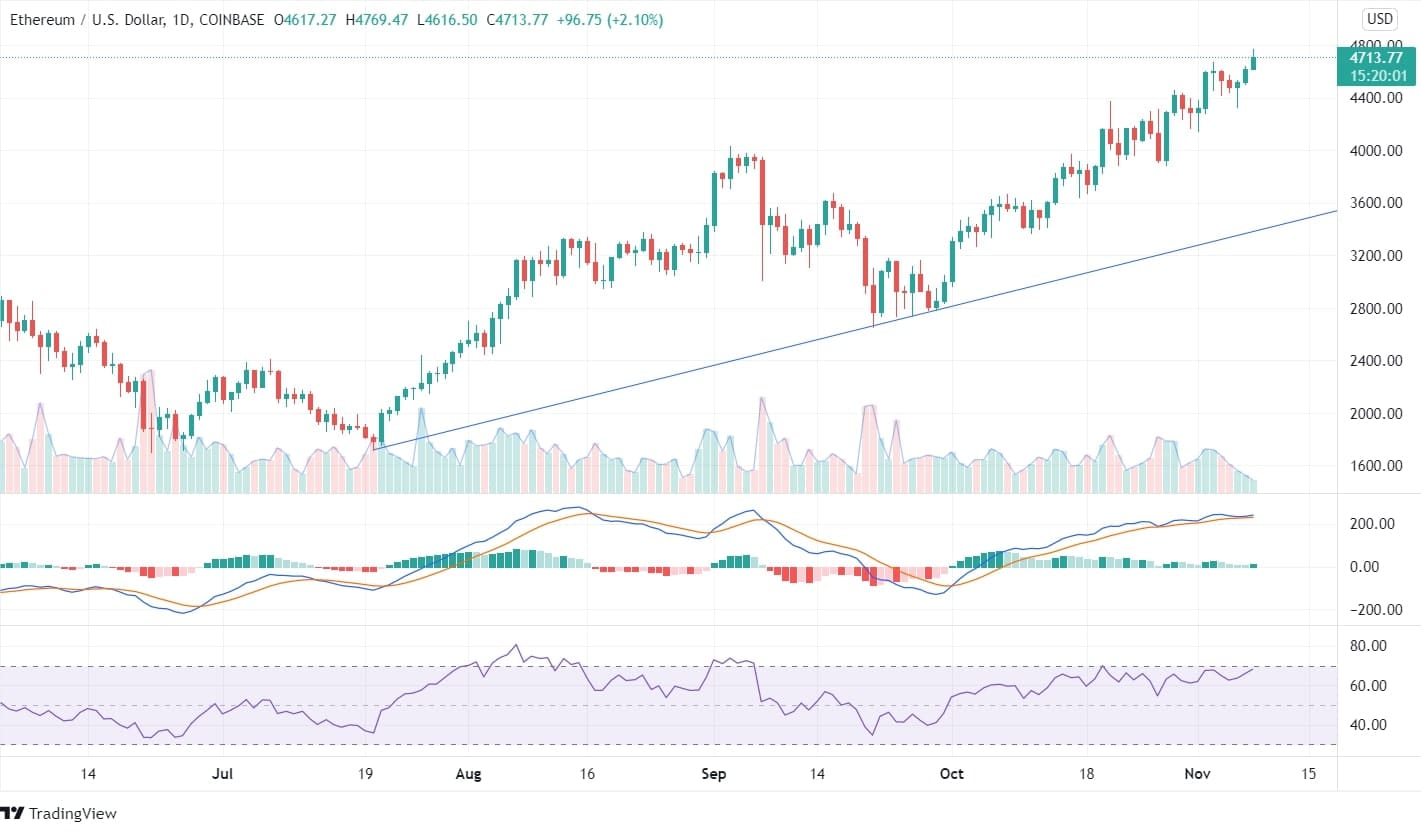
Ethereum allows to build other crypto apps on it, and the second-largest cryptocurrency has been trailing at its highs in the up-trending market. The market was not showing any major moves till the end of 2020. There was remote price movement in favor of bulls or bears, and it was unexpected that the coin with the value of just $300 in the middle of June 2020 would reach $4769 at the beginning of November 2021.
During the recent Bitcoin-led rally, the ETH coin wasn’t left behind. The market capital and the volume of Ethereum have seen a significant increase in the last few weeks. From the beginning of the year, the ETH price is climbing upwards, and on May 12, the crypto formed a new resistance for the first time with a high of $4384. Ethereum gave a return of 620% to its investors from the beginning of the year to mid-May.
On July 20, a new support zone was formed when the Ethereum price started to fall from its highs and reached $1717. When the price started to rise from its support zone is couldn’t reach its previous resistance and made a new resistance zone at $4030.

In the last week from November, the script has given a return of about 12.5% to its investors, and the week previous to the last one gave a return of 14.7%. In the weekly chart, the candles formed higher highs and lower lows after the price started to rise from the edges of the trend line.
A bullish engulfing pattern formed at the edge of the trend line, and the price started to rise from that point was a jackpot for the investors as from there the prices are stretching higher and have given a return of 70% from September 27 till today.
On the downside, the first support zone can be expected to be at $4030, assuming the previous resistance zone to act as a new support level. The technical parameters are indicating an upcoming bullish move with intense buying volume. Both Bitcoin and Ethereum, the two major cryptos, have attained a shot up at prices. Though the ETH coin is still trending, the investors should research the fundamentals and calculate their risk before investing.
In all the long-term time frame charts, the indicators indicate a strong buy signal. However, there is a bearish divergence in RSI in the daily chart, creating some doubt about the bull rally. If the price falls and indicators show a bearish move, we can expect a sell signal. In the current scenario, the bull rally is trending, and the prices are ascending.

