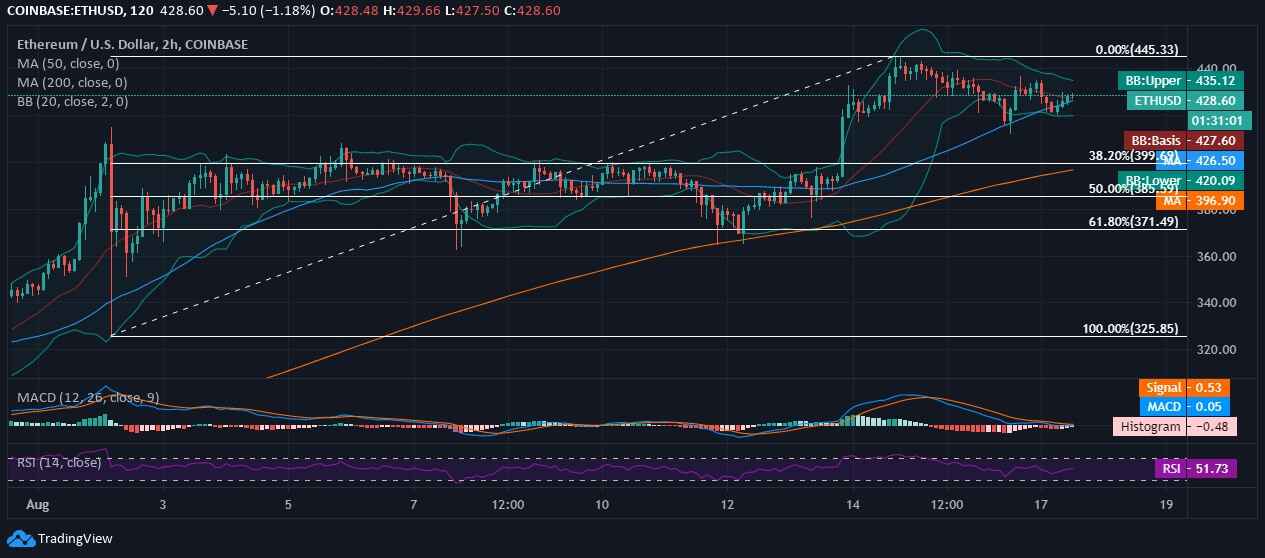
Ethereum, at the time of writing this analysis, was trading above $400 at $428 and is retaining complete support. ETH—the second-generation crypto is the massive altcoin and is often holding a concurrent motion with Bitcoin. However, the coin is holding a slightly different momentum with the most significant cryptocurrency by market cap.
ETH coin after having traded laterally right after the market crash in March is now back to hitting new heights and breaching stringent resistances. On the other hand, Bitcoin and XRP are seen holding a similar and flat momentum, however, Ethereum appears gaining, but the intraday is sluggish.
Ethereum Price Analysis

Ethereum, on the above 2-hourly chart, is seen breaching the flat curve after rising above $370 price area with a bullish candlewick in the previous week. With little or no momentum in the intraday, ETH coin appears bearish but is hitting no extremities as per the laid 20-day Bollinger Bands. The coin is holding complete support at $425 & $395 price area as per the short-term and long-term daily MAs.
The currency is maintaining is stance above 38.20% fib Retracement level and is away from a complete bearish crossover with major support held at $400. The 20-day BB does not project any trading extremities; therefore, we predict a smooth movement until a possible breakout as per Ethereum forecast.
The MACD indicator exhibits a bearish divergence due to the sluggish intraday trend. The RSI of ETH is at 51.73, with no trading extremities hit. The major support and resistance to watch out for lies at $400 & $440, respectively.

