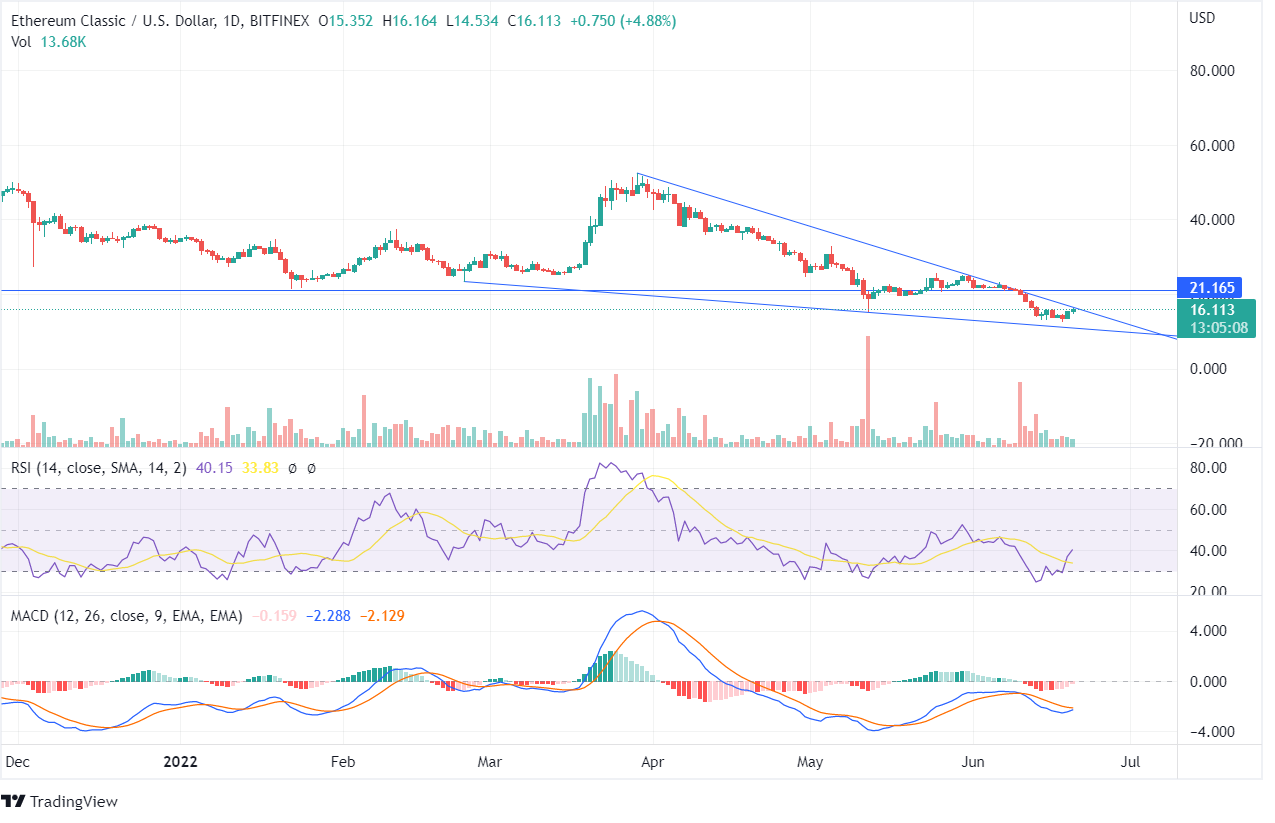
Ethereum Classic was at $52 till March-end, after which the price constantly declined and reached its 52-week low and is currently trading at the market price of $16. ETC token has been moving below the downtrend line for the past few weeks as the bears are pushing the price down like other cryptocurrencies.
ETC price is moving at the same zone from where a major hike happened in the past, and the token reached its higher highs. On the weekly chart, the price is moving at the edges of the trend line, and if the bulls try to elevate the price, the token may head towards its resistance zone. In the 4-hour time frame chart, the Ethereum Classic’s price has closed above the last peak of $16, and the RSI indicator looks to enter the overbought zone.
On the daily chart, bullish candles have formed in the past 2 days, and the forming candle is trying to suppress the trend line but is moving below it. On June 19, there was a huge upsurge, and however, for the confirmation of an up-trend market, the ETC price should close above the trend line with higher highs and higher lows.
During mid-June, the price of Ethereum Classic entered the oversold zone and has recently turned from the oversold zone. The RSI indicator is 40 currently indicates neutral price movement. The MACD line is below the Signal Line; however, once the bullish candles continue to form, the MACD line can come above the Signal Line, and there can be a bullish opportunity.
The volume bars show a favorable move toward the bears as the ETC price has been falling drastically. There have been diminishing red candles in the histogram chart, indicating the bullish trend can be upcoming if the Ethereum Classic price reverses from this point.


