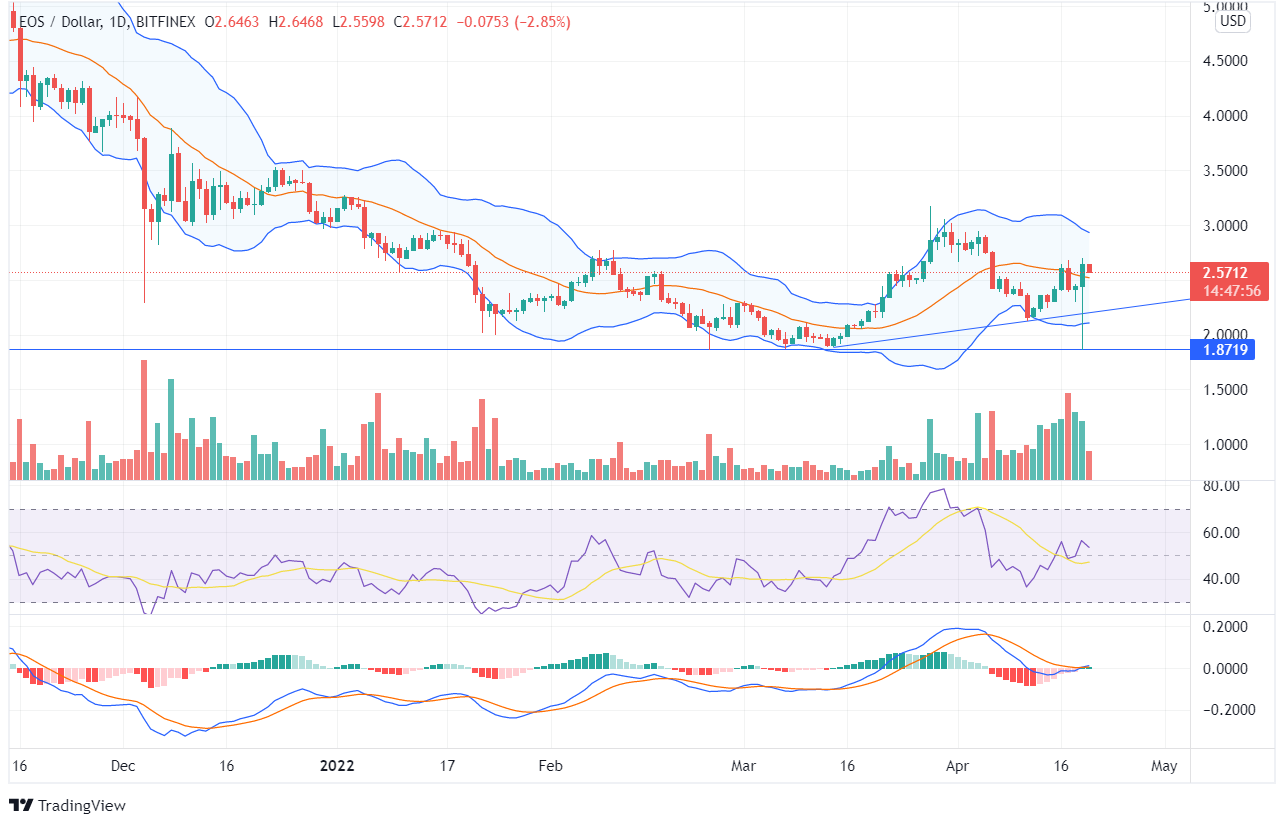
EOS has begun to rise from its lows and has entered a bullish territory. In the last week, the coin took the support of the uptrend line and began to uplift. In an intraday session on April 19, the coin moved in favor of bulls, though the bears tried to push the price downwards but failed.
If the EOS price had closed below the up-trend line, there could have been a rejection for the bulls. During March-end, the price formed higher peaks, which can indicate an upcoming bullish momentum.
On the daily chart, the coin’s value couldn’t move below the Support line, and the technical parameters indicate a bullish signal. The coin was bearish until the 1st week of March; after that, the token began to recover. During the previous week, EOS showed a significant price movement, and the volume candles on the daily chart show a favorable bullish opportunity.
The price is moving in between the Bollinger bands and may head towards the upper band if the bulls continue to push the price upside. The RSI indicator is at 54, and it may head towards the overbought zone. Once the price closes above $3.17, a strong bullish momentum can be expected in the long run.
The MACD line has just started to move above the Signal line, which can be an occasion for the bulls who want to enter the trade for a long-term profit. A bearish engulfing pattern was formed on the daily chart on April 17, but still, the token declined. This can be a noticeable opportunity for the bulls, as the price rejected to fall, and there was the formation of bullish candles.


