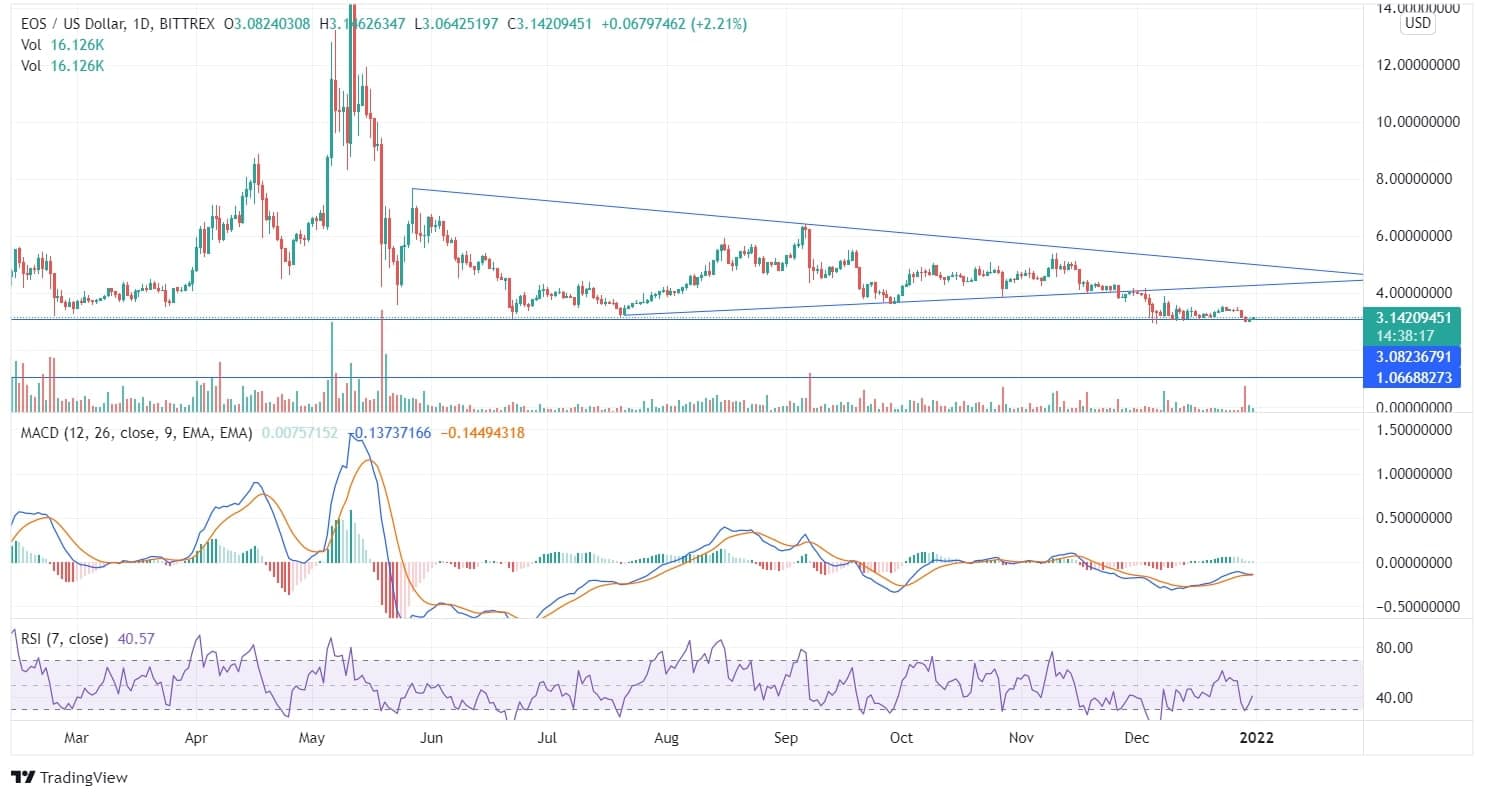
EOS has been moving in a downtrend pattern from May onwards and has formed lower lows. The coin gave substantial profits to its bearish investors in the second half of the year and an equivalent return to its bullish investors in the first half of the year.
Though the coin reached its high of $14.37 in the mid-year, it is currently sprawling at a similar position from where it instigated to escalate. EOS is moving at its crucial position with the current price of $3.13. During this entire month, the coin moved sideways with isolated price movement. The coin has suppressed the up-trend line stretching over from July and is moving in consolidated momentum.

On 29th December, there was a supportive bears volume, but the price didn’t decline, and the bullish candles were formed after that. This can be an opportunity for bullish investors. If the price turns around from this point, a minimum target of $5 can be expected, and if the price falls, it may reach a low of $2.
On the 7-day chart, the price has been evolving at the edges of the support zone for the past few weeks. The forming candle shows a bearish engulfing pattern, leading to a slope down of price. The coin in the long-run chart is already in the bearish zone.
The current candle is not closing below the swing low of the past week’s candles can be an opportunity for the bulls. However, the technical parameters are still indicating a selling zone.

