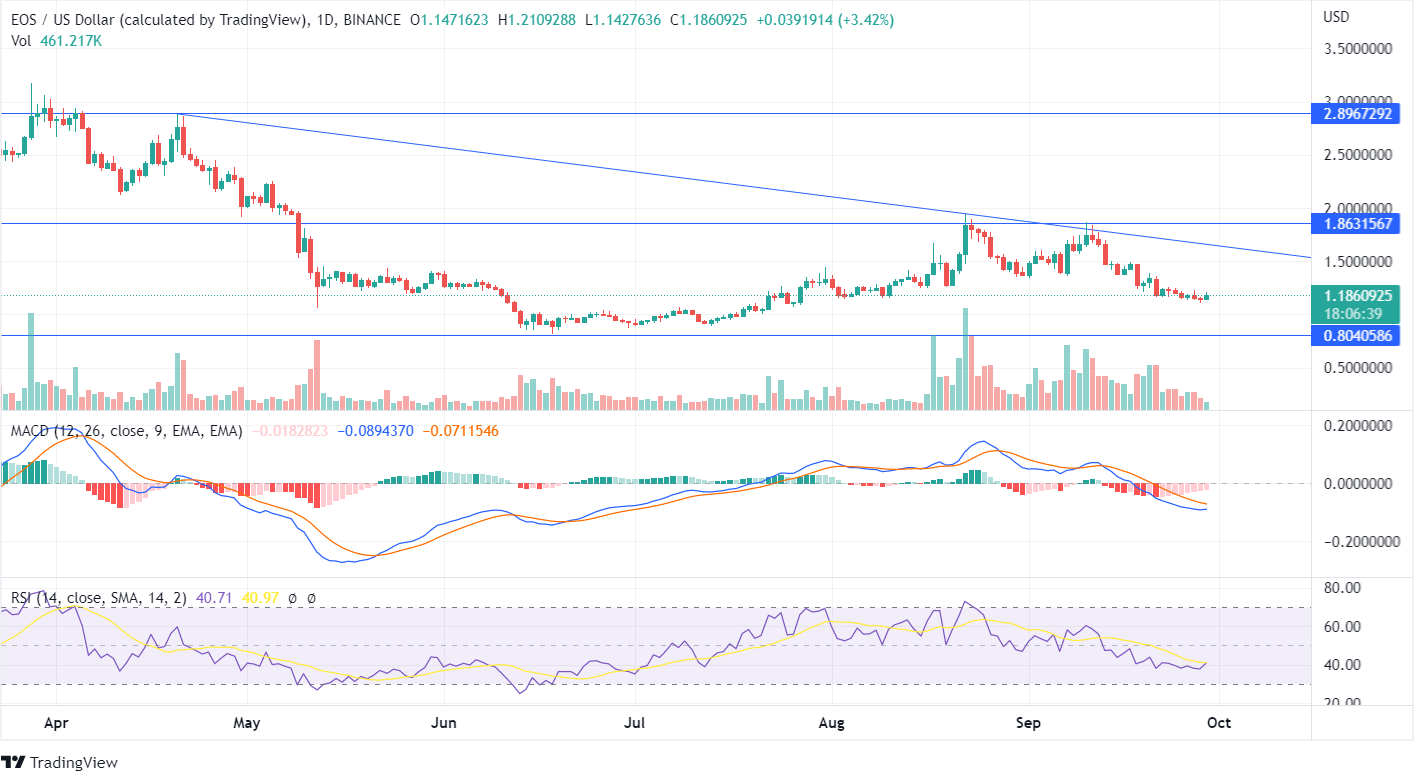
EOS recently turned from its peak of $1.86, and it may move towards the support zone of $0.80 as the price has been moving in between the horizontal range for the past few days. The coin got tested at the trend line and the resistance line for an upliftment, but the bulls couldn’t push the price up, and the EOS token turned around to its lows.
In the last week, the daily candles show consolidated momentum as neither the bulls nor the bears show any major price action. Like other cryptos moving sideways, the EOS token forms indecision in the market for an upcoming price movement.
The EOS volume bars moving below average shows the market is unfavorable towards the bulls and the bears. There is a requirement of immense investors with a favorable interest for robust price action. The MACD line has been moving below the signal line, and the histogram chart shows diminishing red candles.
Thus, investors should wait for the upcoming candles of EOS for a clear view. The RSI indicator being 40 shows neutrality; however, the RSI line tilting upwards may head upside if the bulls push the EOS price upwards.
The weekly chart shows the formation of descending triangle pattern as the price had hit the trend line and continued to fall. There has been the formation of lower lows on the weekly chart, and during the past two weeks, the EOS price shows a major downfall as there has been the formation of bearish candles as the token reached its resistance point.


