

On Friday, March 17th, the cryptocurrency market recorded a low volatility trading with slight selling pressure evidenced by the long-wick neutral candle in Bitcoin price. The overhead supply has restricted BTC movement below the 200-day exponential moving average, accentuating the broader market as intact. With the latest onchain data showing whale distribution, the coin price faces the risk of further downfall.
Key Highlights:
- Since January 2025, the Bitcoin price has experienced a steady correction trend resonating with two trendlines of a falling wedge pattern.
- A potential death crossover between the 20-and-200-day exponential moving average could drive a short dive in BTC value.
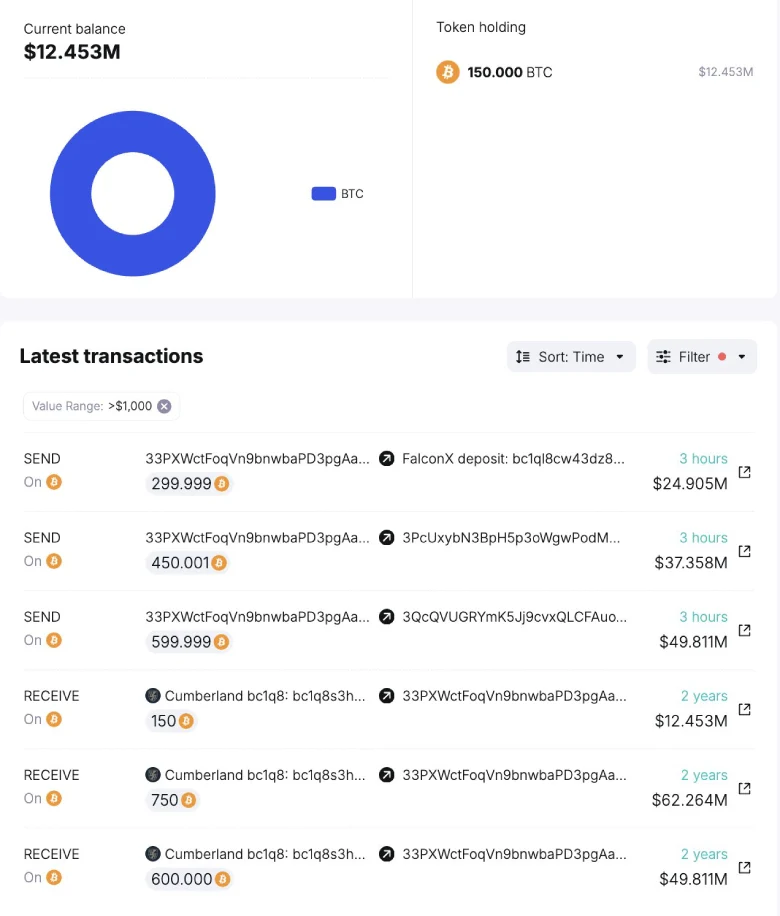
- A dormant whale resurfaced after 1.5 years, selling 300 BTC, and realizing a 219% profit.
Bitcoin Price Risks Another Drop as Whale Sells 300 BTC
According to blockchain tracking platform Spot On Chain, a dormant Bitcoin whale has resurfaced after 1.5 years, depositing 300 BTC (worth $25.1M) to FalconX.
The whale originally accumulated 1,500 BTC on August 18, 2023, purchasing them from Cumberland at an average price of $26,353 per BTC—a total investment of $39.5M. With Bitcoin now trading significantly higher, the investor has realized an estimated 219% profit on the holdings.
Historically, the whale selling activity has accelerated the selling pressure in the market, indicating the BTC price could take another dive to lower levels.
Falling Wedge Pattern Signals a Crucial Breakout for Bitcoin Recovery
Since last week, Bitcoin price has been trading consolidating below the 200-day EMA slope with multiple neutral candle formations. The buyers struggling to surpass this key barrier signals strong selling pressure and a general bearish sentiment in the market.
In addition, the fast-moving 20-day EMA is on the verge of crossing below the 200-day EMA slope for the first time in 6-months, typically, indicating rising bearish momentum. However, the historical data shows that this bearish crossover is followed by a short dip in BTC price before it secures a suitable bottom support.
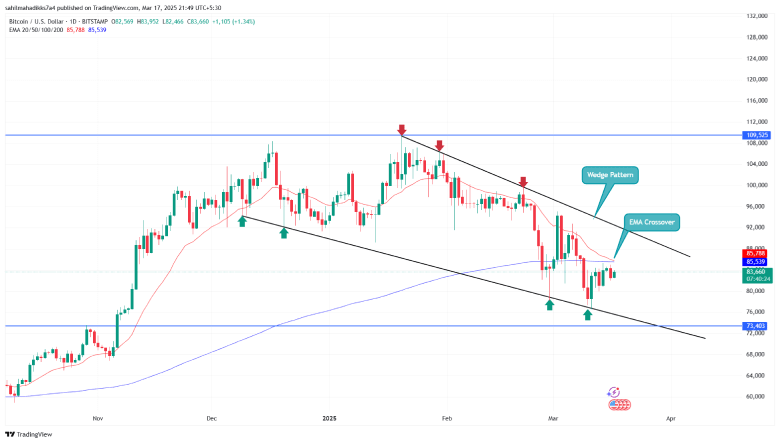
If the theory holds, the coin price could dive another 12% to rest the lower boundary of the falling wedge pattern. The lower trendline has acted as a firm springboard for buyers before challenging the overhead trendline.
For risk-averse traders, the wedge pattern breakout is crucial to break the current correction trend.
Also Read: CZ Advocates for Utility over Tokens for AI Agents in Crypto
