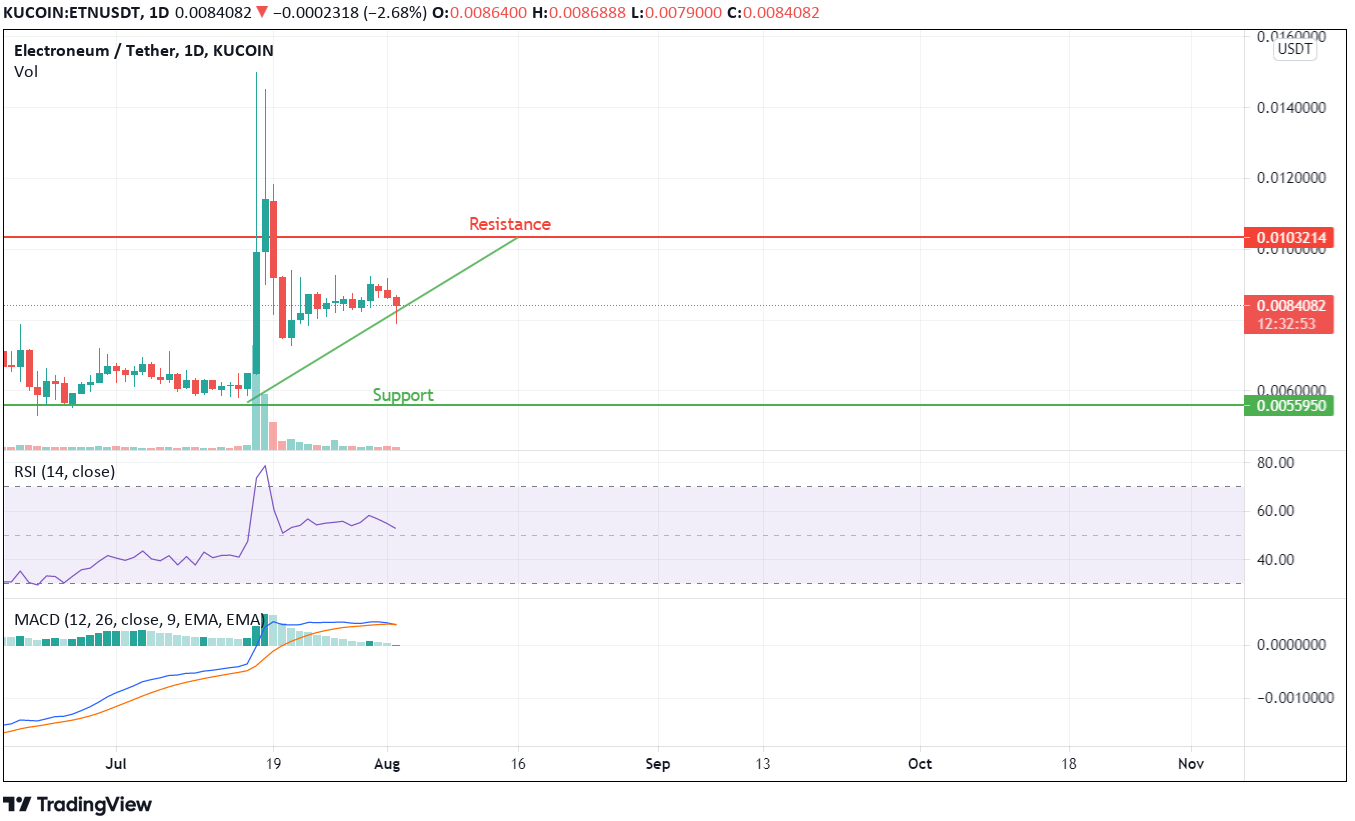
A recent jump of 50% in intraday seems to have been a singular occurrence. While two days of back-to-back 50% intraday gains seem to have initiated a profit booking sentiment in ETN. It has been consolidating with hopes of escaping the resistance with strong buying pressure. However, on technical grounds, there seems to be a higher probability of breakdown in this cryptocurrency.
Electroneum Price Analysis

RSI is bent towards the southern direction, indicating a selling pressure being created on daily charts, but lower buying also indicates buying interest. The current resistance is almost 20% above the last traded price. While support is active at a downfall of 35%. MACD intersection in the positive axis might be indicating some more sell-offs in the coming days, and there seems to be the first red candle on MACD charts being developed since May 27, 2021. This indicates significant weakness in technical terms.

