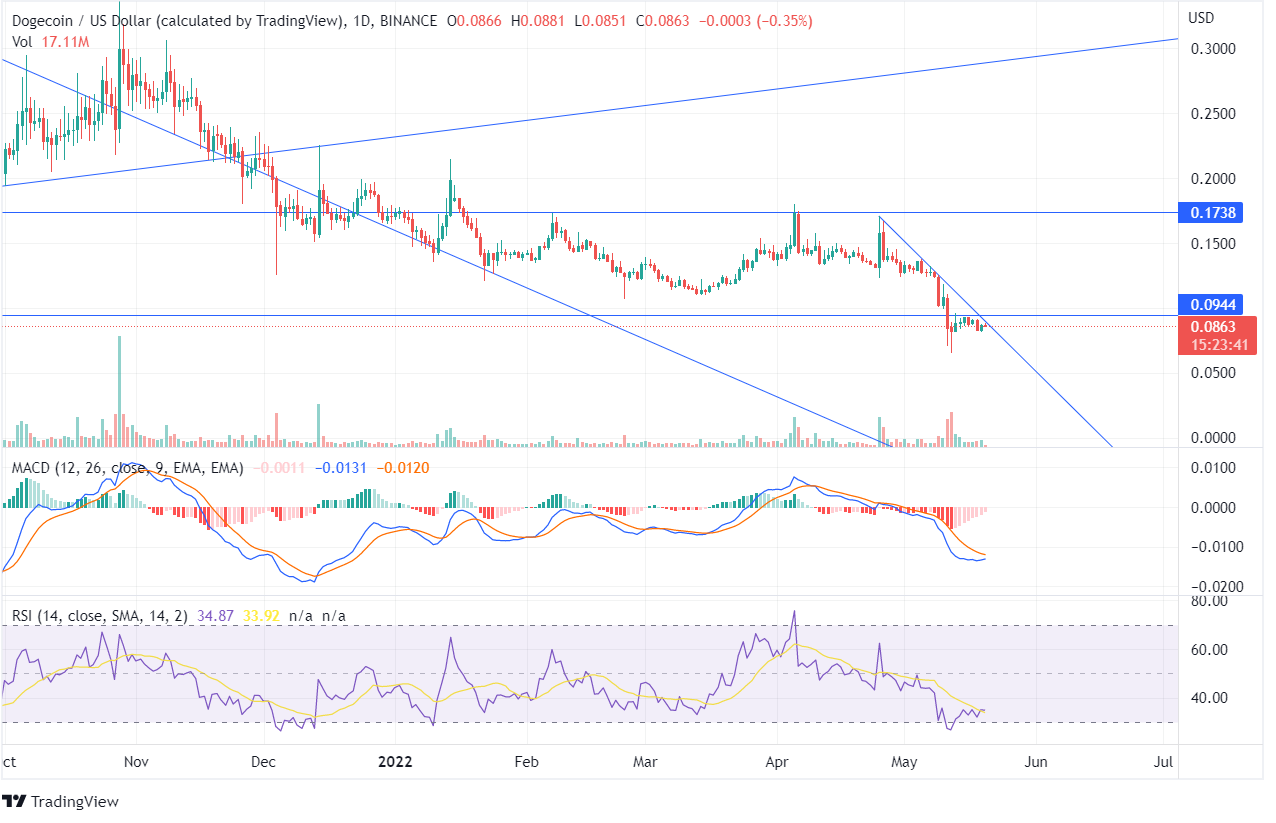
Dogecoin has been declining in the past few months, forming lower low peaks on the weekly chart. The coin’s value has reduced more than 88% after its all-time high, indicating a strong downtrend momentum of the token.
In the month of March, the coin began to rise but couldn’t close above the resistance of $0.1738 and continued to reduce and reach its lows. The technical parameters on the long-time frame chart signal an upcoming bearish trend as the indicator moves towards the lower zone.
Outlook on the daily timeframe is consistent with the long-time frame chart. DOGE, which made a high of around $0.7600 the same month last year, is now down significantly from those levels. The swift gain in DOGE prices ultimately led to an equally fast selloff and reduction in value. Check out the Dogecoin forecast to see when the DOGE prices will begin an uptrend.
The current downtrend is still strong and hasn’t shown signs of reversals so far. Dogecoin price has been breaking downward barriers time and again over the last year. Right now, Dogecoin is at the point where it saw a lot of demand, and its price exploded to the upside to make its life highs.
Support areas are from $0.0400 to $0.0650, the latter being the price that quite recently stopped the counter from going lower any further for now. RSI went into the oversold zone near this support area.
An oversold RSI reading of 34 indicates an overstressed sellers’ market. There may be room for Dogecoin prices to increase or stall at the current levels as the market participants decide what positions to take finally.
This, in turn, would decide the future direction of the DOGE. Soon after entering the oversold territory, the RSI quickly turned higher and crossed over the 30 lines. Investors looking to enter this market should remain vigilant in opening fresh buy positions at current levels since the market hasn’t shown definitive signs of a turnaround.


