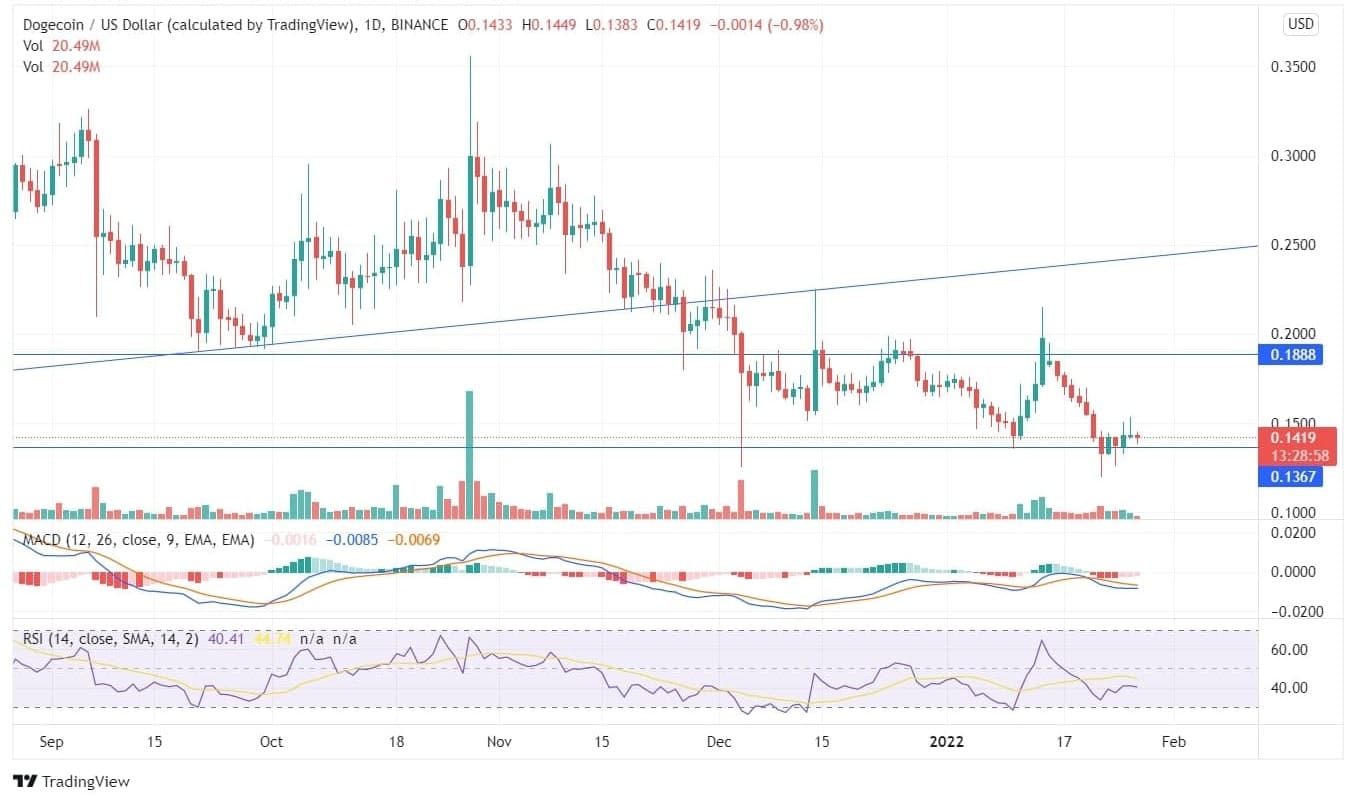
Dogecoin after being at its highs of $0.35 in October declined constantly and is currently $0.14. Though the bulls tried to push the price upside on December 14, 2021, but couldn’t breach the uptrend line extending from last June. The price is trailing at the bottom horizontal which has been a major support zone for the upliftment of the coin in the past. In the 2nd week of January, the coin begun to rise and registered amost 62% hike. However, the Dogecoin price couldn’t supress the top horizontal line and ascend further, rather the bears pushed the price back to its support zone. In the past six days, there has been remote price movement thus creating an indecision regarding the further price action.

If we look at the weekly time-frame, the price of Dogecoin is moving under sideways channel in between a price range. There has been formation of swing lows in the previous week and the forming candle at the support zone. Though the technical parameters are indicating a bearish zone but the investors should wait for the coin to close below the low for a sell trade to confirm an accurate Dogecoin price prediction.

