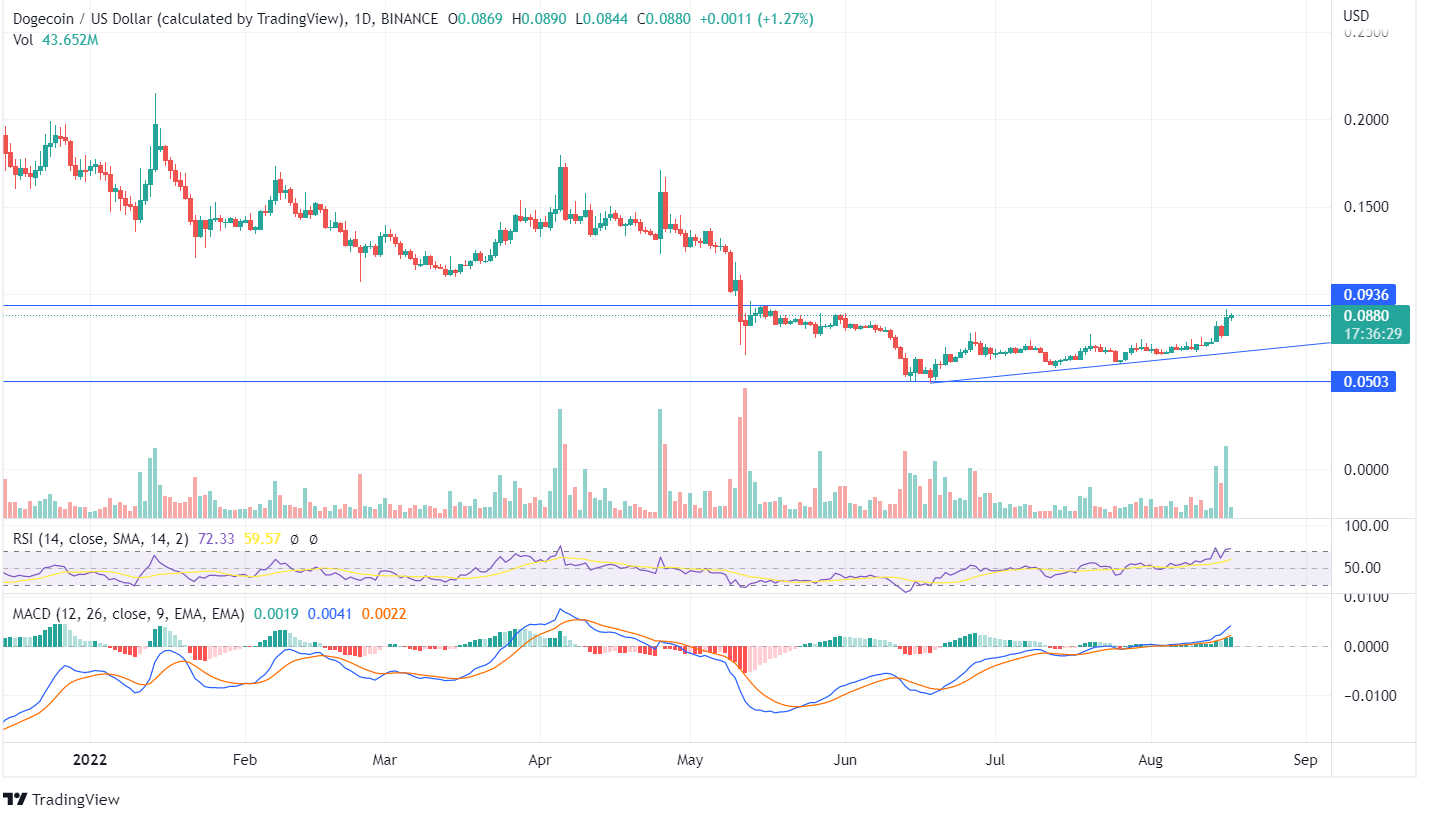
Dogecoin was moving sideways between the price range of $0.09 and $0.05 after a constant fall in the price from its higher highs. The value got tested several times at its lows for further decline, but after rejection, the DOGE token turned. The coin is expected to reach a near resistance of $0.09.
There was a formation of a bullish engulfing pattern yesterday as the candle closed above the recent highs with a huge hike. During June, there was a bearish divergence between the RSI and price as the price declined, but the indicator couldn’t. The Dogecoin price has rejected the divergence and is moving up along the up-trend line. Read our DOGE predictions to know the future price projection of the coin.
There had been supportive volume for bulls yesterday as the price surged with a noticeable return for the bulls. The MACD line trades above the Signal line and the green candles of the histogram denote an upcoming bullish trend. The bullish momentum can be expected if the forming candle closes above the previous highs. The RSI indicator is 72 shows the DOGE token has entered the overbought zone.
On the weekly chart, the MACD indicator signals a bullish trade as the weekly candles are moving in an up-trending pattern taking the support of the trend line. During the previous week’s candle, Dogecoin had surged significantly.
After a continued decline in price over the weeks, the token has reached its lower lows and a robust support zone from where the price reached its higher highs in the past. Once the price closes above the near resistance, a gainful opportunity can be expected for the bullish traders.


