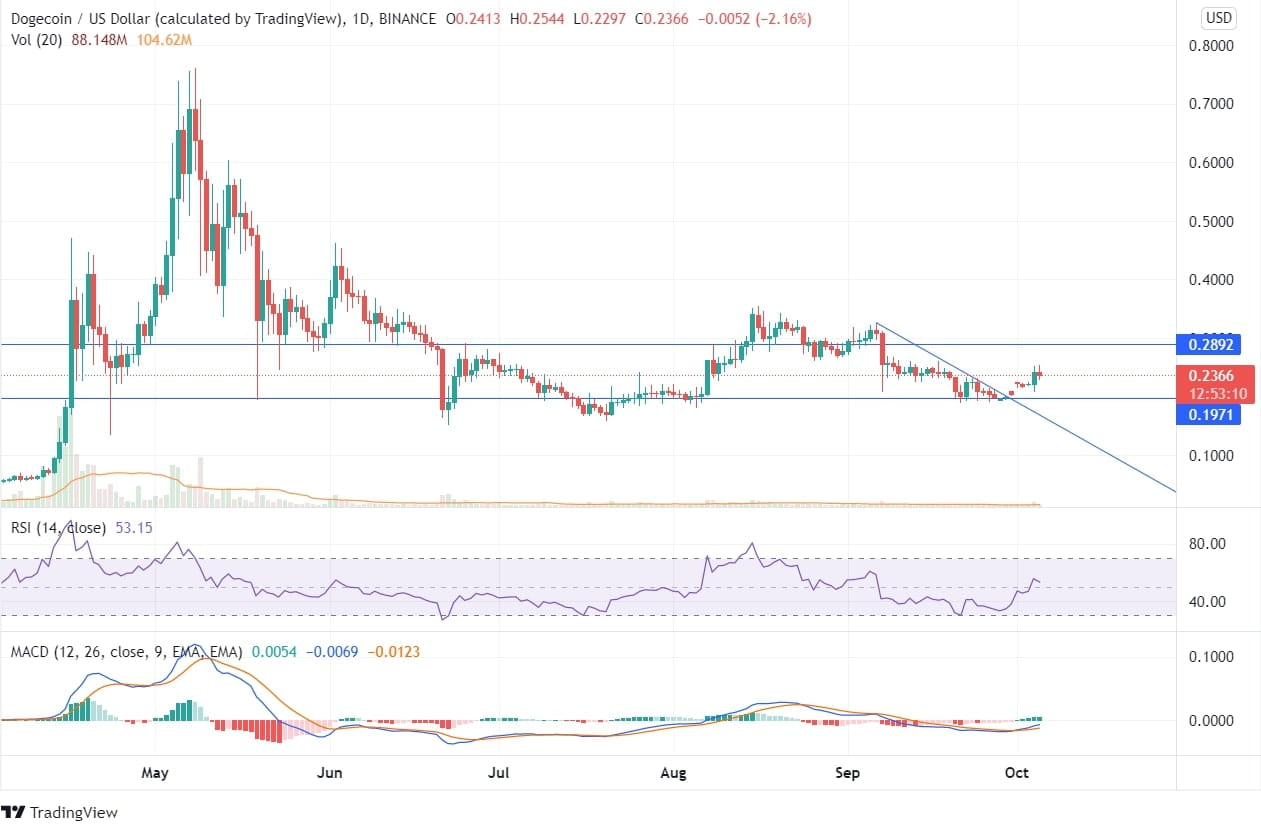
Dogecoin, one of the more popular cryptocurrencies, has had a rough few months. Dogecoin price peaked out at around $0.70 during the first two weeks of May 2021 before tipping into a steep nose dive, which took price tumbling over 75% eroding massive investor wealth on the way. The crypto finally found support at $0.1600, and prices started to reverse in mid-July.
The bull run lasted for about a month, quickly taking the DOGE price close to $0.35, but this price change wasn’t met with heavy demand, and Dogecoin was moving higher on light trading volumes. Later, the DOGE price fell again, and it is now trading near the supporting weekly trendline.
We observe weekly candles now appearing to form a bullish engulfing pattern, which, if forms in the upcoming trading sessions, could send higher prices if the right volume supports the price action.
After a strong downfall of DOGE/USD price from May to July end. However, after that, the coin could not generate much positive momentum. The price has crossed the downtrend line being formed from September 06 and is rising upwards.

RSI is in the neutral zone at 52, stating that the price can go up or down depending upon the sentiments of the people. A strong bullish divergence is visible in daily charts, followed by consolidation of the price. This can be treated as an opportunity for bullish investors. The expected take profit can be around $0.3064, with a stop loss of around $0.1967.
The price is in its overbought zone; thus, bullish traders need to be cautious about price reversal. However, MACD crossing above the signal line is giving a bullish indication. There is an immense volume of buyers in the 4-hourly chart, thus attaining positive upside momentum. After observing hourly and daily charts though there can be bullish price action still, investors should do their due diligence before investing.

