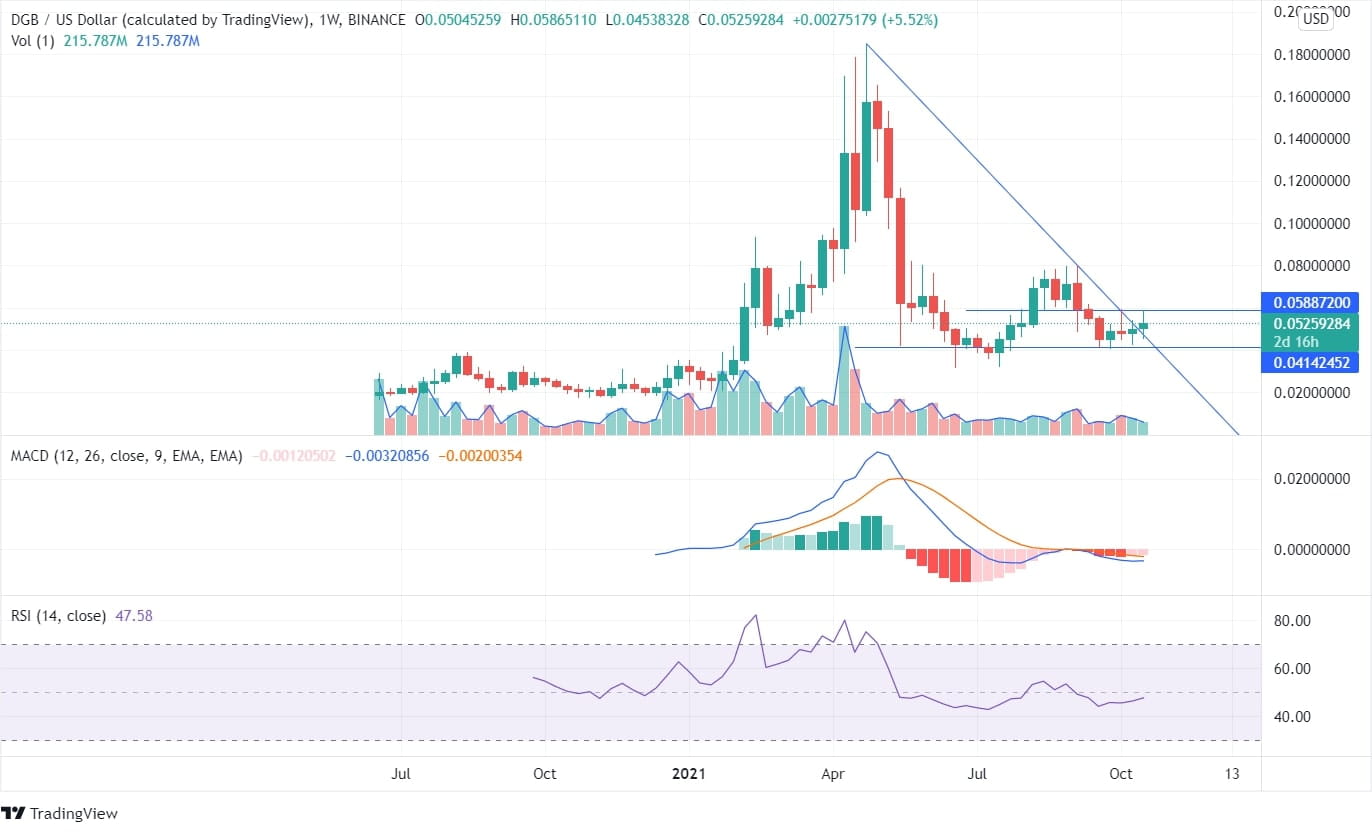
After a major downfall of DGB price since May 01, 2021, from the highs of $0.16 to a low of $0.031, the currency has seen a measured price move. DigiByte price is reflecting sideways trading with moderate fluctuation.
DGB, at its support zone and the price moving sideways, is indicating a consolidated momentum. The bulls and the bears are creating indecision regarding the price. The current price formation on the edges of the downtrend line, along with consolidation, may create a huge impact on the coin’s future. However, if the DGB coin manages to cross the recent high of $0.065, it may initiate a significant upside rally.

In the current scenario, there was immense pressure in bulls volume on October 21, 2021; bulls took the price to $0.085 but could not close to recent highs.
The RSI being at 54, is neutral and moving towards its overbought zone, currently showing sideways or flat trends in the daily chart. The MACD indicator being above the signal line gives bulls hope for rewarding opportunities though the DGB price hasn’t shown much up move after the indication and is getting consolidated. The volume shows a rise in green candles, denoting bulls’ volume.
In the weekly chart, the DigiByte price is within the channel, and the candle with a high of $0.061 is not being crossed by the recent candle. The MACD indicates a sell signal in the weekly chart along with red candles in the histogram chart. The minimum take profit is expected to be $0.080 with a stop loss of $0.032.
The hourly, daily, and weekly charts denote different trading opportunities as the technical parameters in different time frames give different indications forming an unbiased opinion for traders.

