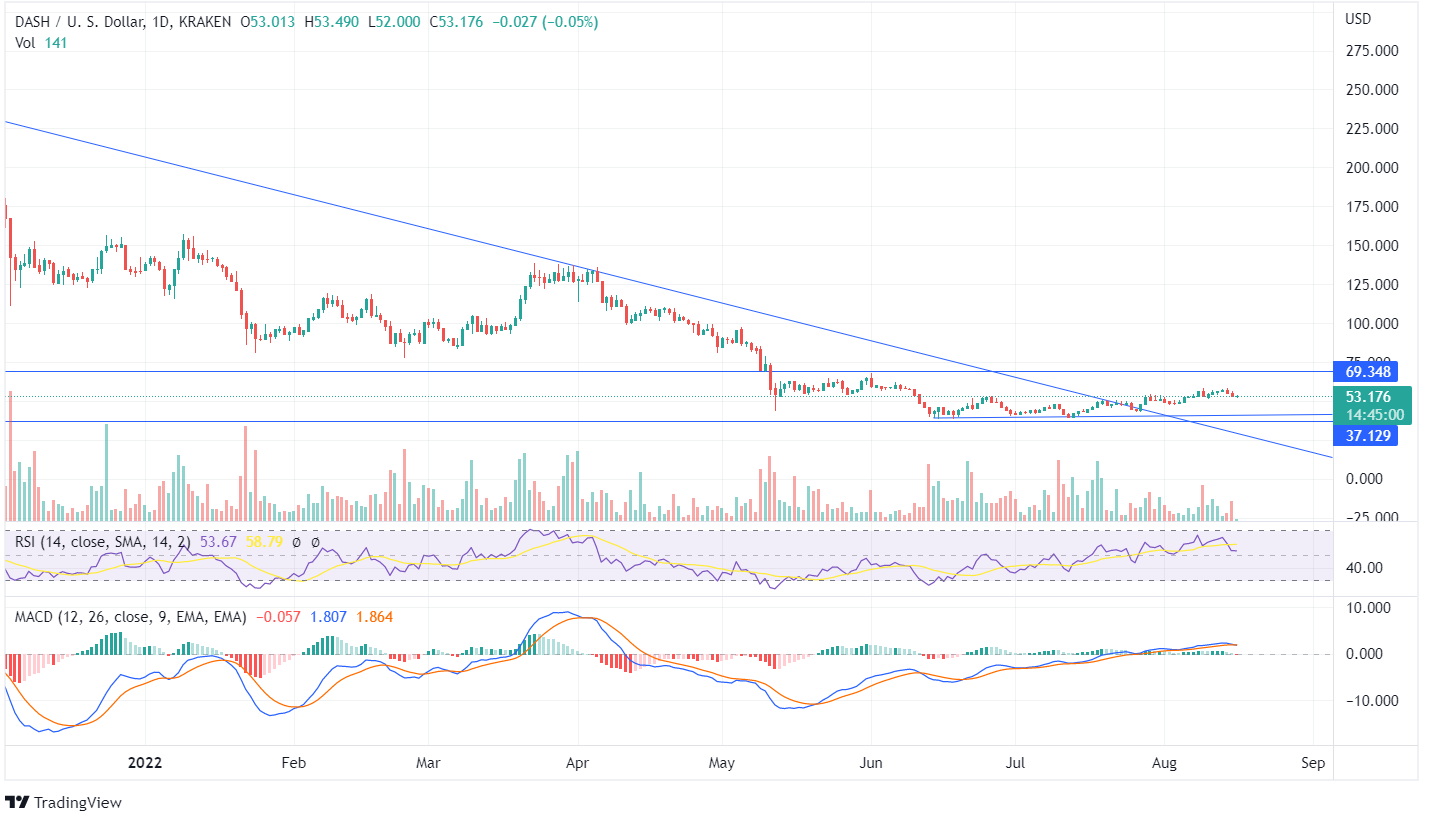
Dash has been moving below the downtrend line as the price drops from the peak of $247 to the latest value of $53.17. The coin shows consolidated momentum as the price moves between the range of $69 and $37 over the past few days as there is high indecisiveness. The price has recently taken the support of the positive trend line as the bulls push the token’s value upside.
There is a need for supportive volume in favor of bulls or bears for major price action in any direction, as currently, there is a neutral indication of an upcoming price movement. On the previous day, there was a marginal decline. The price traded in the oversold range during mid-June, and the price took a turnaround from its lower lows.
The RSI being 53 shows neutral price movement; however, if the DASH value continues to rise, RSI may trade in the overbought zone. The MACD and the Signal Line overlap each other, thus not indicating any price action. Once the price hits the resistance of $69 and closes above it, a bullish trend can be expected. However, if the price continues to decline, it may reach its support of $37.
On the weekly chart, there has been a formation of bullish candles forming higher highs in the last few weeks. However, the forming bearish candle indicates a decline in the Dash’s price, and the price shows a U-turn from a robust support line stretching over past years.
There has been a major rise in the price from the same level where the price currently trades. Once the additional buyers begin to push the price upside, a strong positive trend can be anticipated in the long run.


