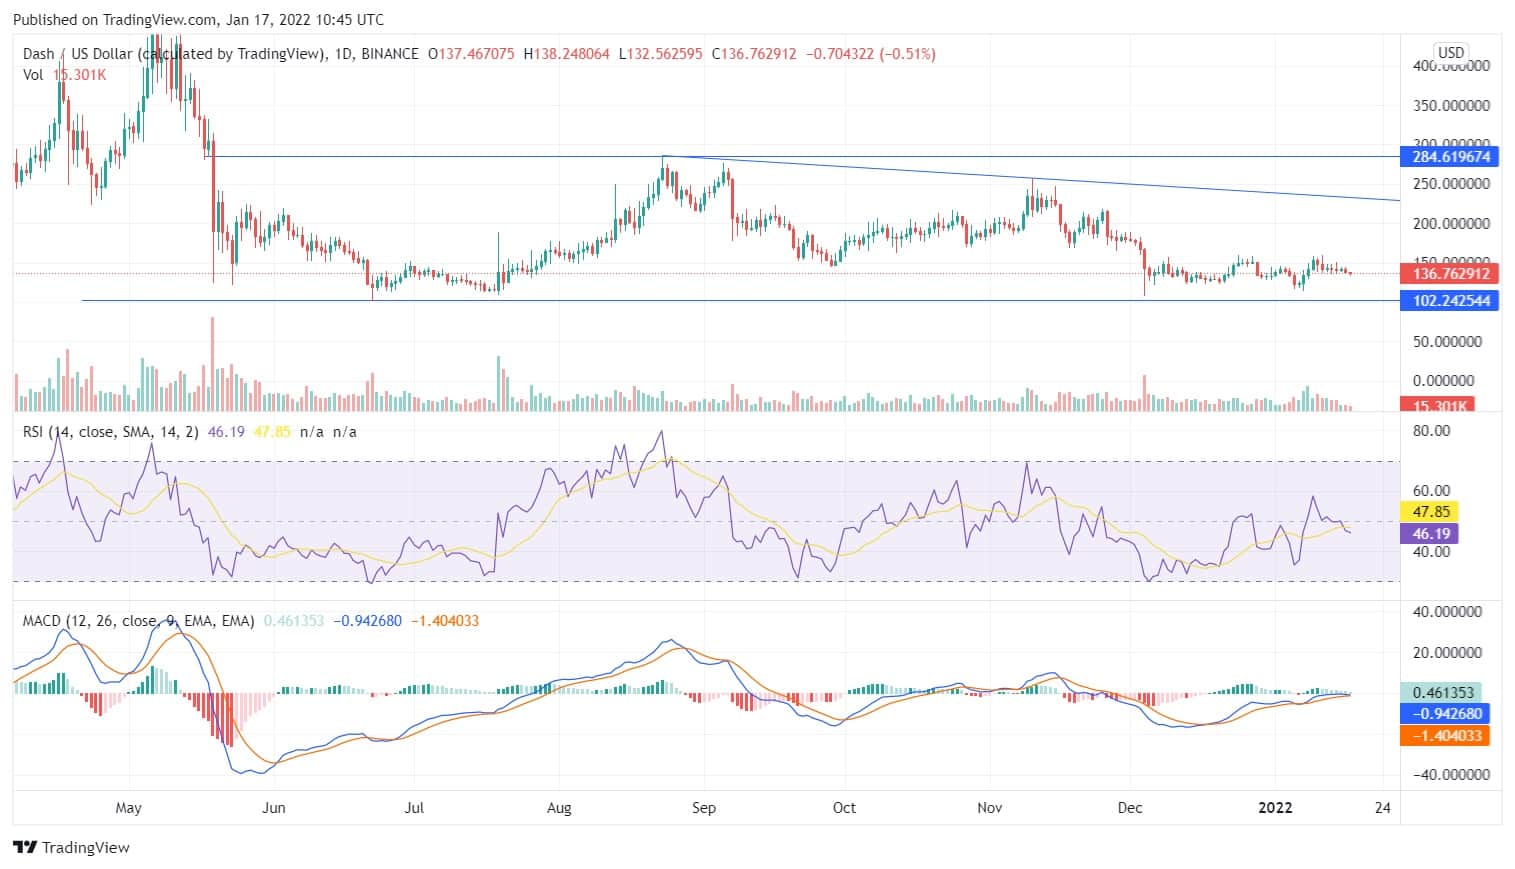
DASH was at its peak during mid-May 2021 with the price of $493, after which it constantly declined and formed troughs at its support zone. The coin has been residing sideways for the past few months between the top and the bottom horizontal lines with the current price of $136. In the past two months, the coin has fallen 88% and was a gainful trade for the bears.
From January 06, the price of Dash began to uplift but could increase only 35% from $117 to $158, after which it turned around along with the formation of bearish candles. There was an isolated price movement in the coin in the past week as neither the bears nor the bulls could push the price in any direction.
On the daily chart, the MACD line is slightly above the signal line with the diminishing green candles on the histogram chart. An uptrend pattern can be expected if the MACD line moves upside down and doesn’t go below the signal line. The RSI being at 46 is neutral. The volume bar looks favorable for bearish investors. On January 08, there was an immense buying volume, but still, the price didn’t shoot up and turned around towards support.
On the weekly chart, the last three weeks’ candles couldn’t cross the high of $159, which was the high of candles formed on December 20. The forming weekly candles are unable to close below or above the candles of the past few weeks, which shows that there is indecision between the bears and the bulls, and neither of them can take any significant price action. The MACD indicator is already in the bearish zone, but the coin has barely shown any deterioration.
Investors should wait for a while before investing for any upcoming price move in any of the directions or should study the fundamentals. The investors can wait for the price to close above or below the swing highs or swing lows for any trading opportunity.


