Dash was developed as a fork of Litecoin, which was an improvement over Bitcoin’s code. Being a fork, Dash already has a strong foundation, but the inclination of buyers towards the older generation and more popularized blockchains will be a tough target for it to breach. Market capitalization has slipped to $443,757,280, which is a cause for concern.
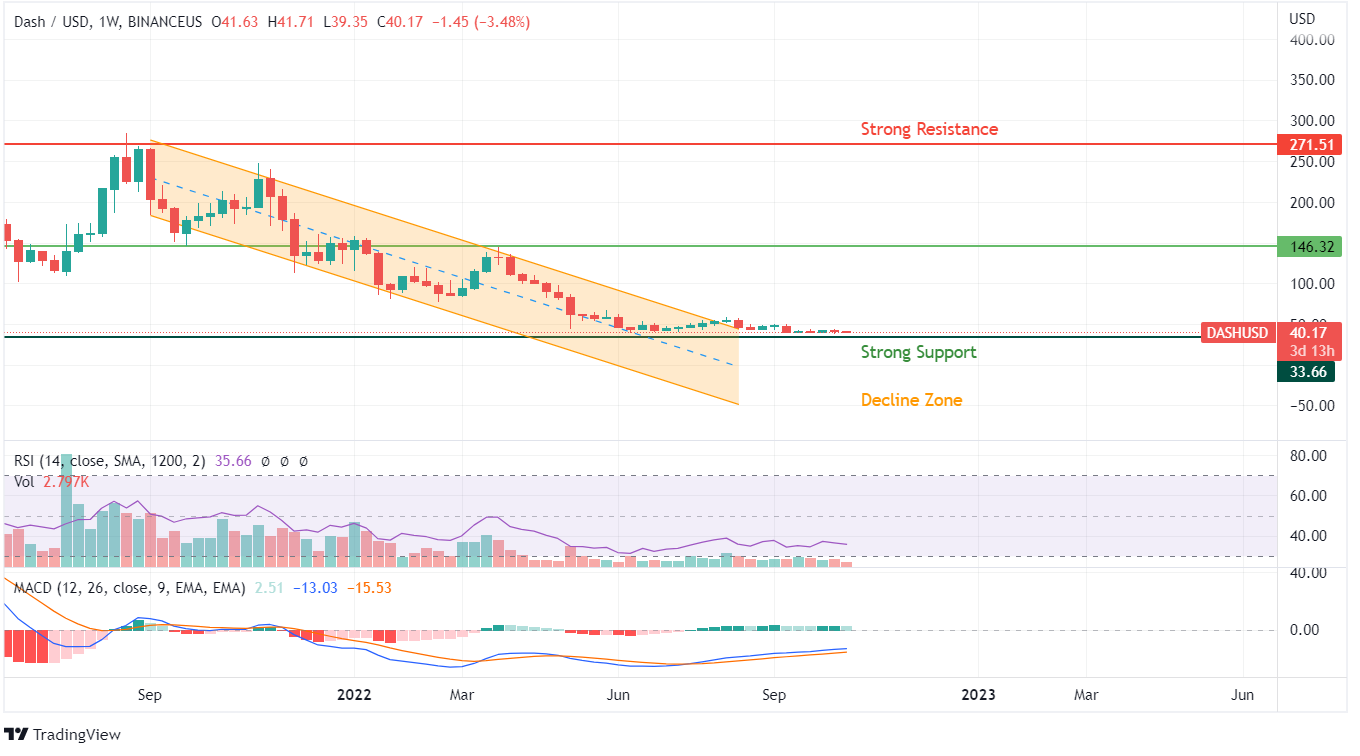
The price action of Dash in the long term or since the last bull run of September 2021 has been on a decline, with back-to-back breaking support levels; Dash has entered a strong bearish zone.
Lower volatility and low transaction volumes are the key signals that would dominate Dash in the negative trend. The fresh level above $100 would have positively impacted, but any attempt to move above is rejected with an even lower price value.
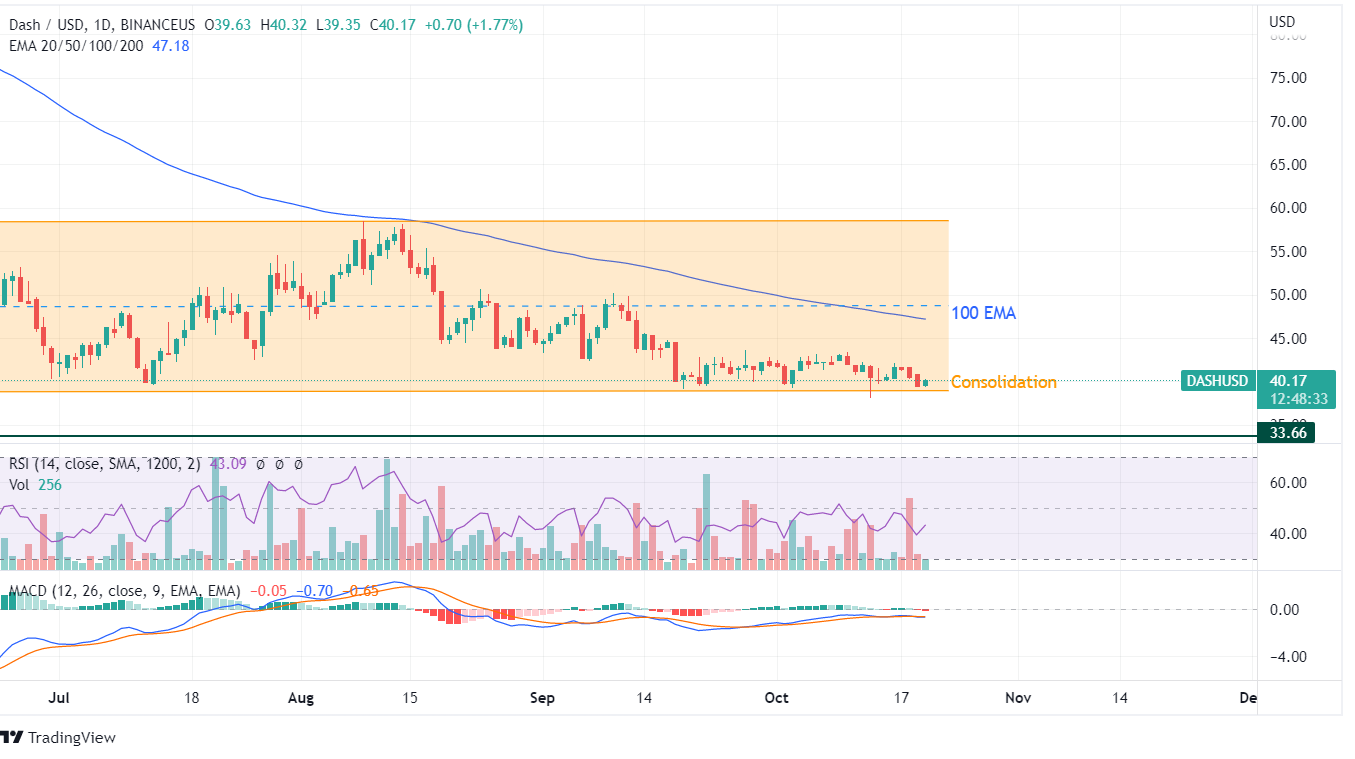
Dash’s price action in the last few months indicates a developing consolidation with buyers and sellers trapped on the levels. The upper band of $60 is developed into a selling zone, while the lower band of $40 has become a buying zone. RSI on daily candlestick charts showcases a sudden rise of transaction volumes enabling the buying sentiment to hit 50, but the subsequent price action becomes profit booking.
The repeated attempts to breach $40 should be considered a negative trend in developing, while the 100 EMA has become another headache for buyers. The outlook for the DASH token looks dim in the short term.
2022, in the beginning, brought some faith in buyers that Dash would be able to outperform the crypto market movements, as in reality, it did achieve this expectation but in a negative trend.
DASH price action was rejected at 100 EMA curve during April 2022, which was seemingly the last upside movement in the last six months. The last strong support, which is the declining value of May 2022, is at the helm of stopping the further downfall of DASH despite the stronger bearish sentiment.
The peak of the last bull run would be the target in the next bull run, but reaching $300 would require an 800% upside movement from current values, which would be a feat if achieved. In technical indicators, RSI showcases huge negativity with levels under 40, while MACD shows a positive turnaround. The different outlooks of these indicators pose the next doubt of possible consolidation and uptrend zone for DASH.


