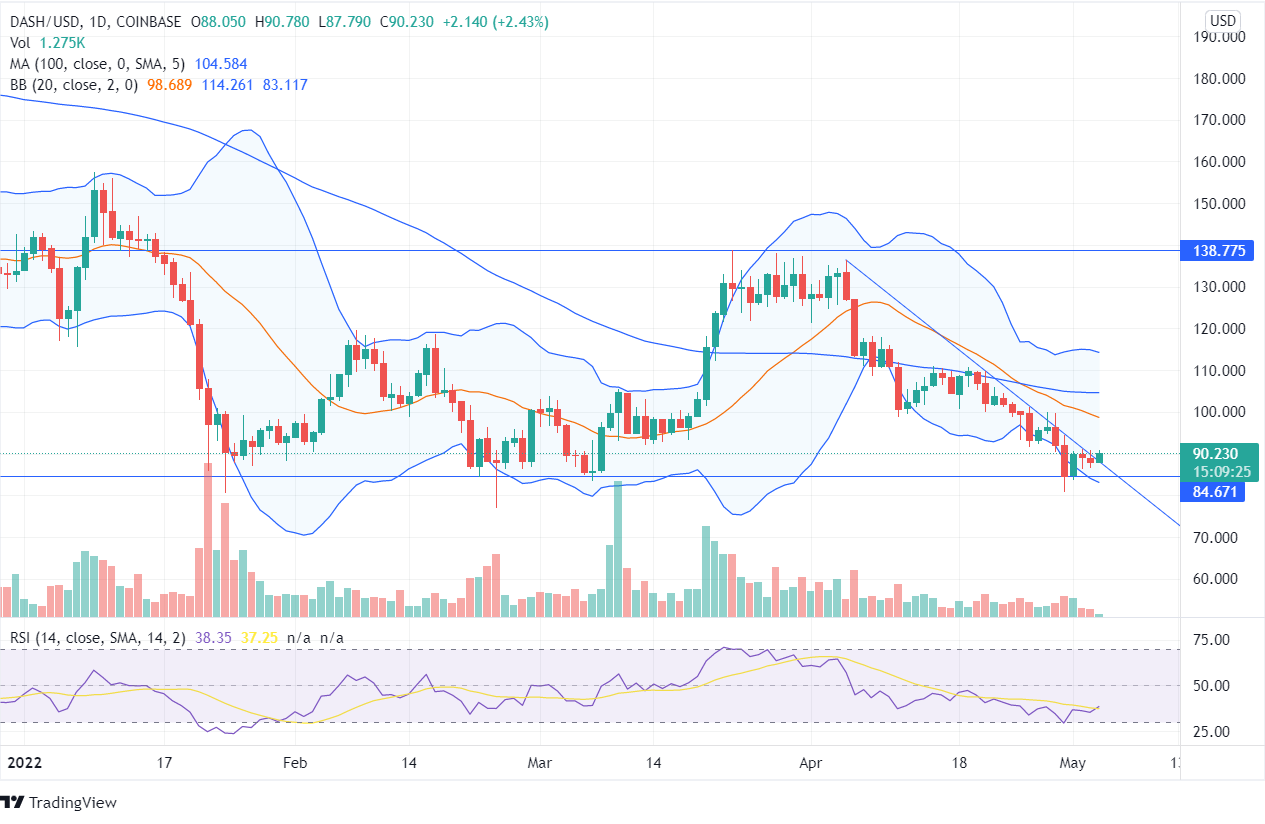
Dash has been correcting from its peaks towards its support level with the current price of $88.82. During the beginning of April, the token started to rise but couldn’t cross the high of $138 and dropped to its lows. The price got rejected at its support and resistance zone and moved between the bottom and top horizontal lines. The candlesticks show consolidated momentum as the price revolves at the crucial point of price action.
On the above chart, the Dash coin reflects a possibility of an uptrend once the price closes above the high of $99. The forming candles show the price ascending from the lows, though on April 30, the bears tried to push the price down but couldn’t close below the support line despite having favorable bear volume.
Dash price has been falling for the past few weeks; the token shows a downfall of 26%. However, once the coin closes above the high of $101 in the long time frame chart, an up-trending pattern for long-term investment can be expected.
The price of Dash token should break the downtrend and trade upwards for a bullish opportunity. The RSI indicator shows the price moving from the oversold zone towards its overbought zone, and if the DASH continues to rise, it may reach a high of $110.
The coin is moving from the lower bands of Bollinger, which indicates an upcoming uptrend of the coin. The volume bar shows remote price movement creating indecision in the upcoming price action. The investors can enter the buy trade willing to face high reward with high risk with a stop loss of DASH price closing below the support line.
However, if the coin price closes below the support line of $85, a downtrend can be expected. The price getting rejected at the bottom horizontal line shows a failure of the further downward movement of Dash.


