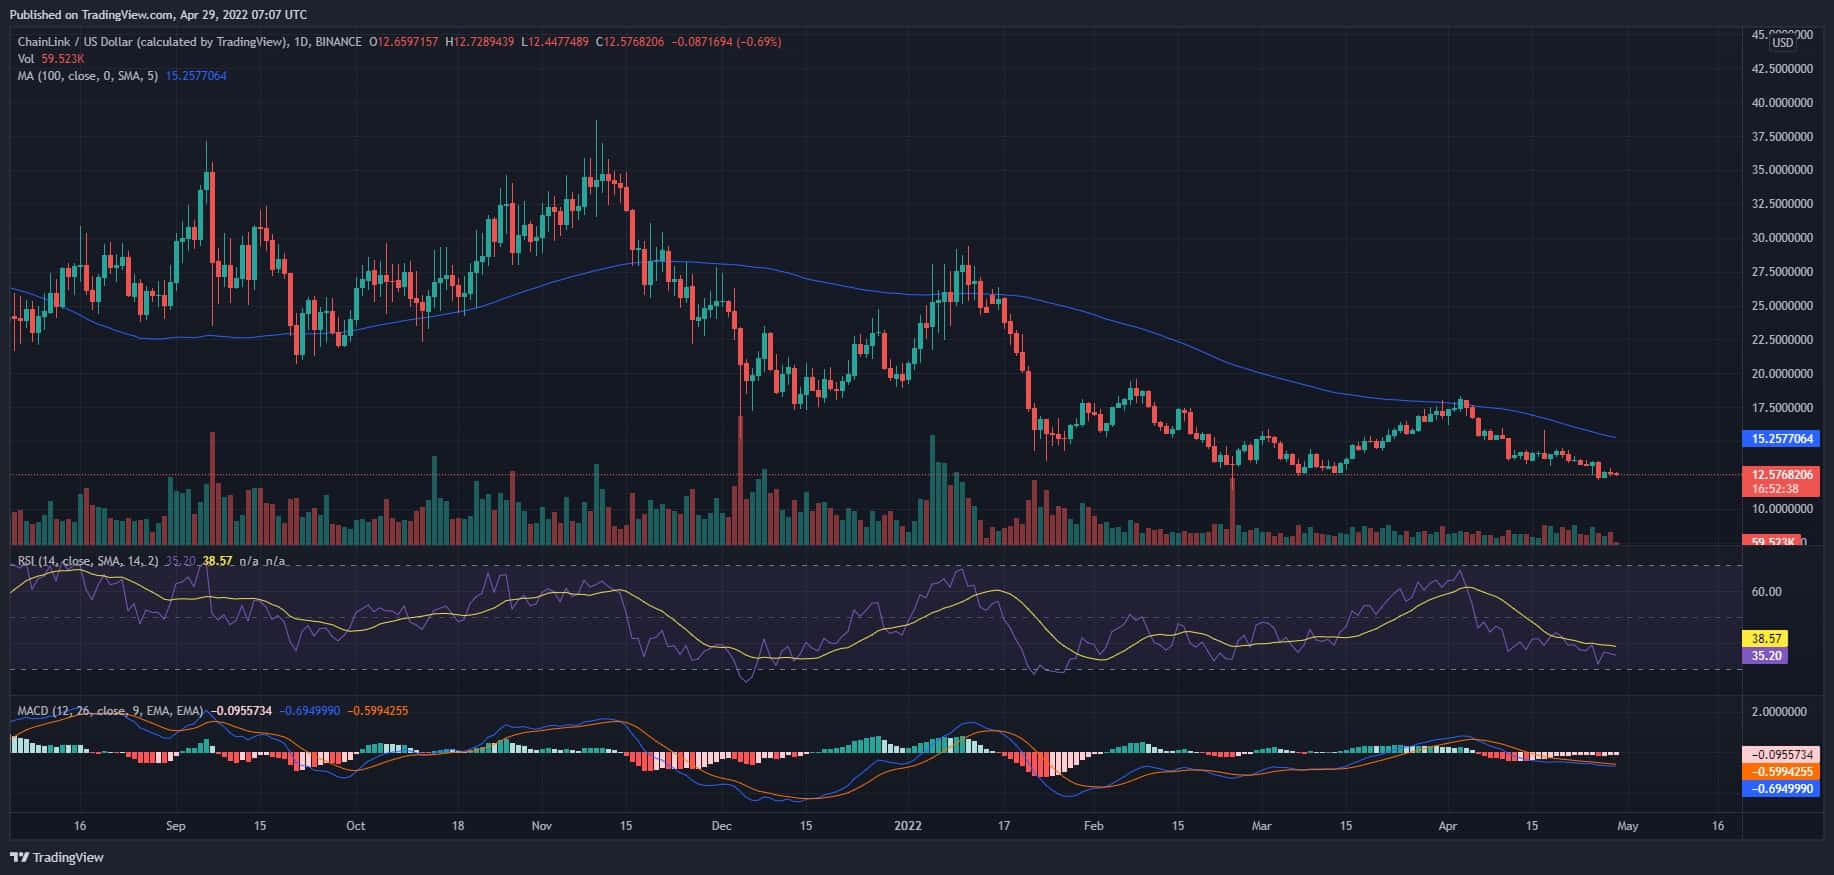
Chainlink is forming lower low peaks and has been moving in a downtrend pattern for the past few months. The coin has reached its support zone with a current market price of $12.57. LINK has been moving in a particular price range for the past few weeks, and the breakout on either side will trigger an intense price action.
The coin price had climbed to the 100-period moving average from the prior demand zone and is revisiting those prices again. According to Chainlink price prediction, if there is any buying pressure in these areas’ prices may eventually revert and head back to the upside pattern and bulls may get the opportunity for long-term gains.
Yesterday, the LINK coin faced a significant correction in the price, taking the price to its lows. The coin is currently showing a turnaround from the support line, which may take the token to its previous resistance of $18.3. The volume bar shows remote movement, thus creating indecision in the upcoming price move.
On the above chart, the RSI is around 35 was about to enter the oversold zone if the bears continue to push the Chainlink price down. The price was moving below the 100-period moving average, and though the price got tested, it failed to rise and declined to its lows.
The MACD line is below the signal line and is already in the bearish zone. The technical parameters are in the sell zone currently; however, the price may turn towards its resistance as the LINK coin is taking a U-turn from its lows.
The investors willing for high risk and reward may enter the trade as the coin has ascended from the same position several times in the past. However, if the coin closes below the support line, a strong downtrend pattern can be expected, which may take the price to lower lows.


