Cardano’s cryptocurrency ADA also witnessed some strong negative trends pushing the value close to the psychological value of $1. Still, with some investor’s action on the broader crypto market, the good news has peeped into ADA too. As a result, we are currently on the second consecutive day of the green zone after a consistent falling sequence of an entire week.
To further analyze the potential of ADA to remain above critical seaport levels and close towards another psychological level of $1.5, investors are eager to witness a bull run again. All those investors buying at the dip of the last two days are the only ones enjoying profits today!
ADA Technical Analysis

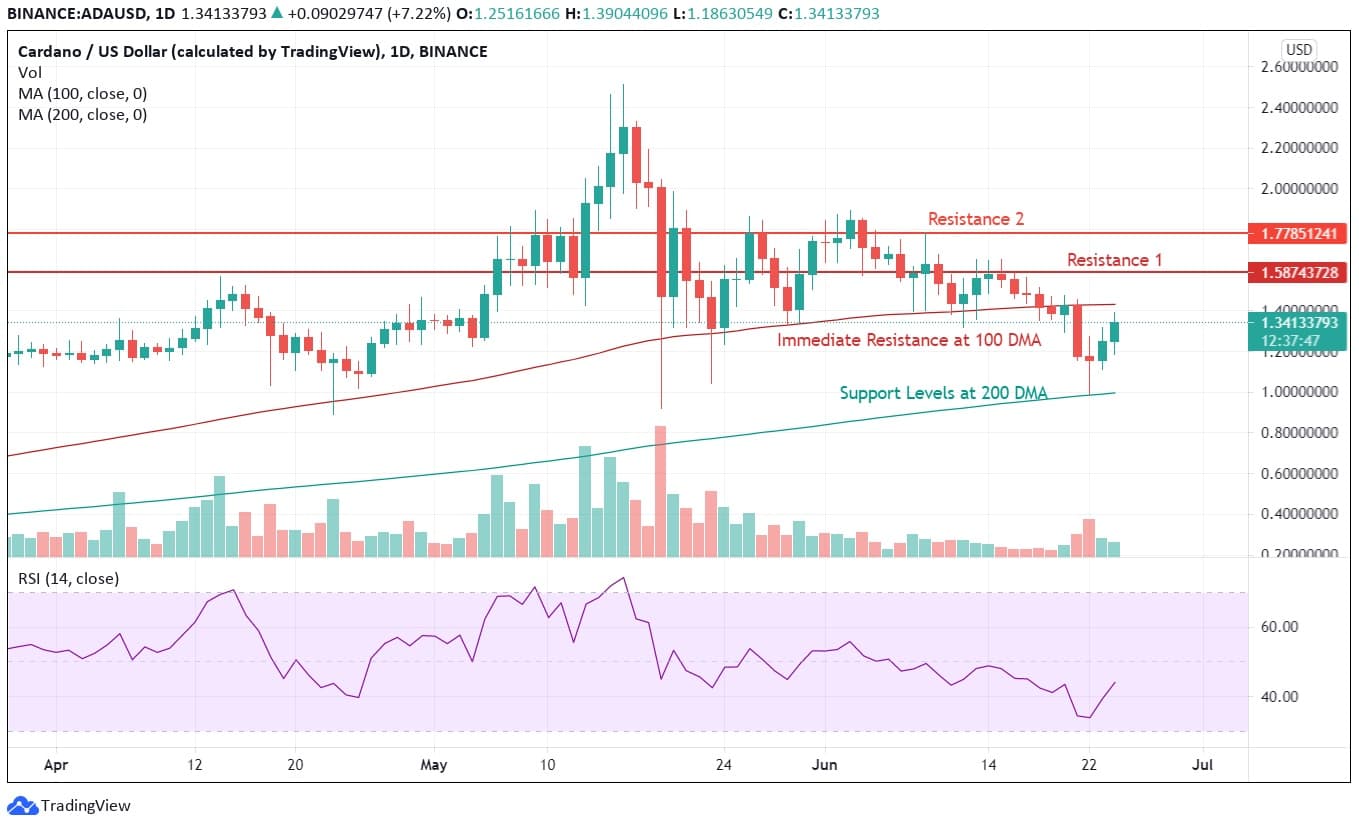
Compared to other cryptocurrencies, ADA crypto coin prediction seems to be in a better situation simply because of breaching its 100 DMA on a substantial negative day of 21st June. While others breached their 100 DMA long ago, ADA held on to the 100 DMA and mostly remained over it, indicating a positive sentiment even on medium outlook. Once ADA crosses the first strong resistance placed at $1.58, the immediate resistance it would be facing is close at $1.77. A good buying sentiment can push this cryptocurrency to an even higher level and close to breach the $2 levels in such a situation.
Currently, ADA has rebounded from its 200 DMA, which should be considered good news for investing in this asset. A revival in its valuation is directly linked with the time taken by buyers to push ADA above the $1.77 levels. At present, the RSI is also showing a reversal from oversold zones to neutral zones, indicating a good potential in the coming days. Currently, the RSI is showing a level of 45 on daily charts.

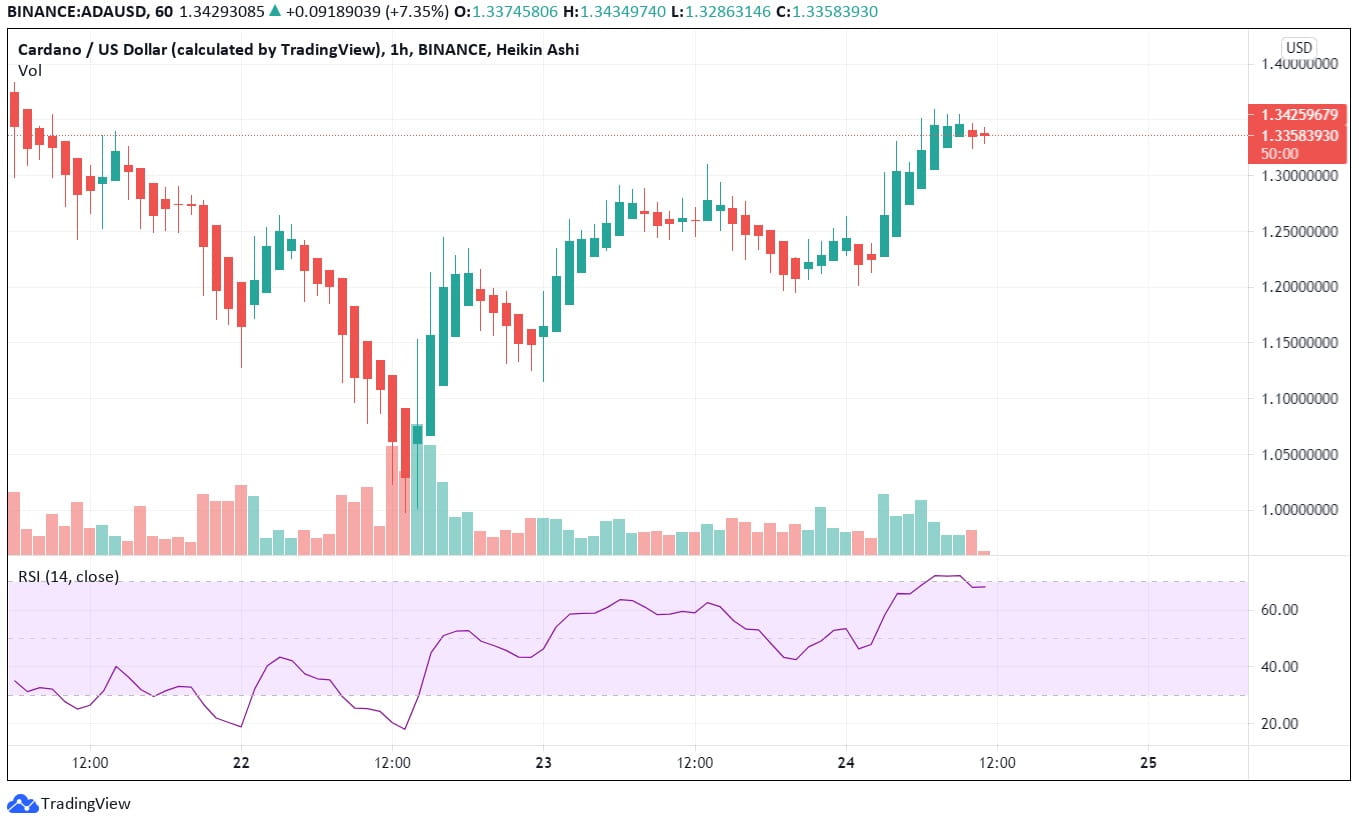
The pattern is perhaps even more substantial on hourly charts since the uptrend rally is taking place with small breaks, indicating consistent buying and selling. Such a situation calls more investors action, and volatility brings a consolidation with itself. For ADA to close above $1.55, it would require some green candles.
An indecisive candle formed at 11.00 hours indicates a selling trend in the coming hours before rising to a higher high. This indication is also confirmed by RSI, which indicates a level of 63 on normal charts.
Apart from this, to predict the future of this currency, you can check forecasts and top news on Cardano thoroughly so that you can plan the right time of investment and further earn huge returns in the future.

