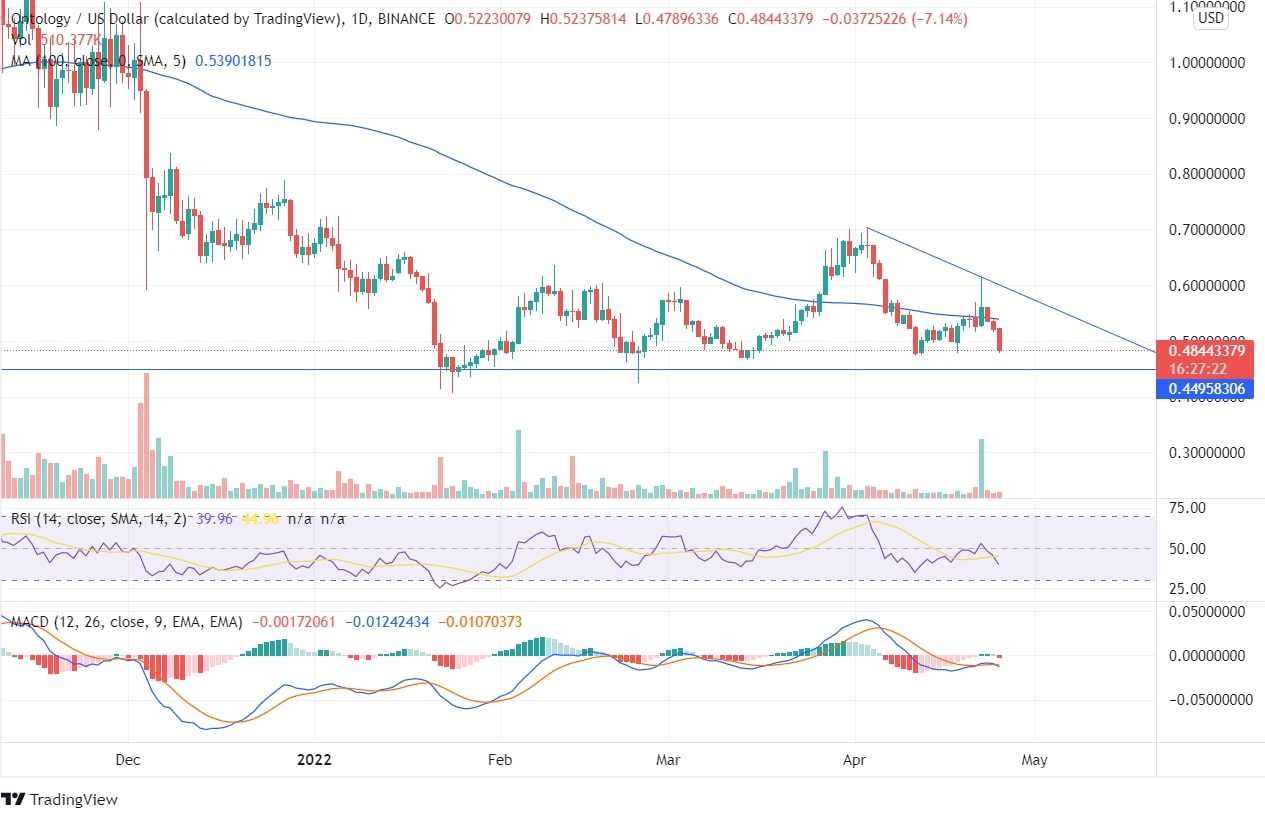
Ontology (ONT) is moving in a downtrend pattern with the current price of $0.48 after falling from its high of $1.27. Today, the ONT price has marked a decline of 8%. During the beginning of April, the coin formed a higher high pattern but couldn’t close above the high of $0.7 and began to correct downwards. The forming candle is moving towards its support zone as the bears are constantly pushing the price downwards.
The price trend of Ontology looks bearish for the near term; however, once the coin reaches $0.44, a turnaround can be expected. The price got tested on April 22 but couldn’t ascend, and the bearish candles were formed after that. The volume bar was favorable towards bulls; however, the bulls couldn’t take the ONT price higher, which could be an opportunity for the bears. The Ontology price is constantly following the downtrend line on the chart, and the technical parameters on the longer time frame are currently neutral.
The RSI indicator may trade towards an oversold region if the coin continues to move down. Once the Ontology coin reaches the oversold zone, it may turn back towards highs. The MACD line and the signal line are currently overlapping each other, thus not indicating any clear move.
The ONT token has got tested at the support line of $0.44 in the past and has failed to correct below this level, thus which can be buying opportunity for the investors. The 100 period Moving Average shows that the coin may continue downside movement for the near term.


