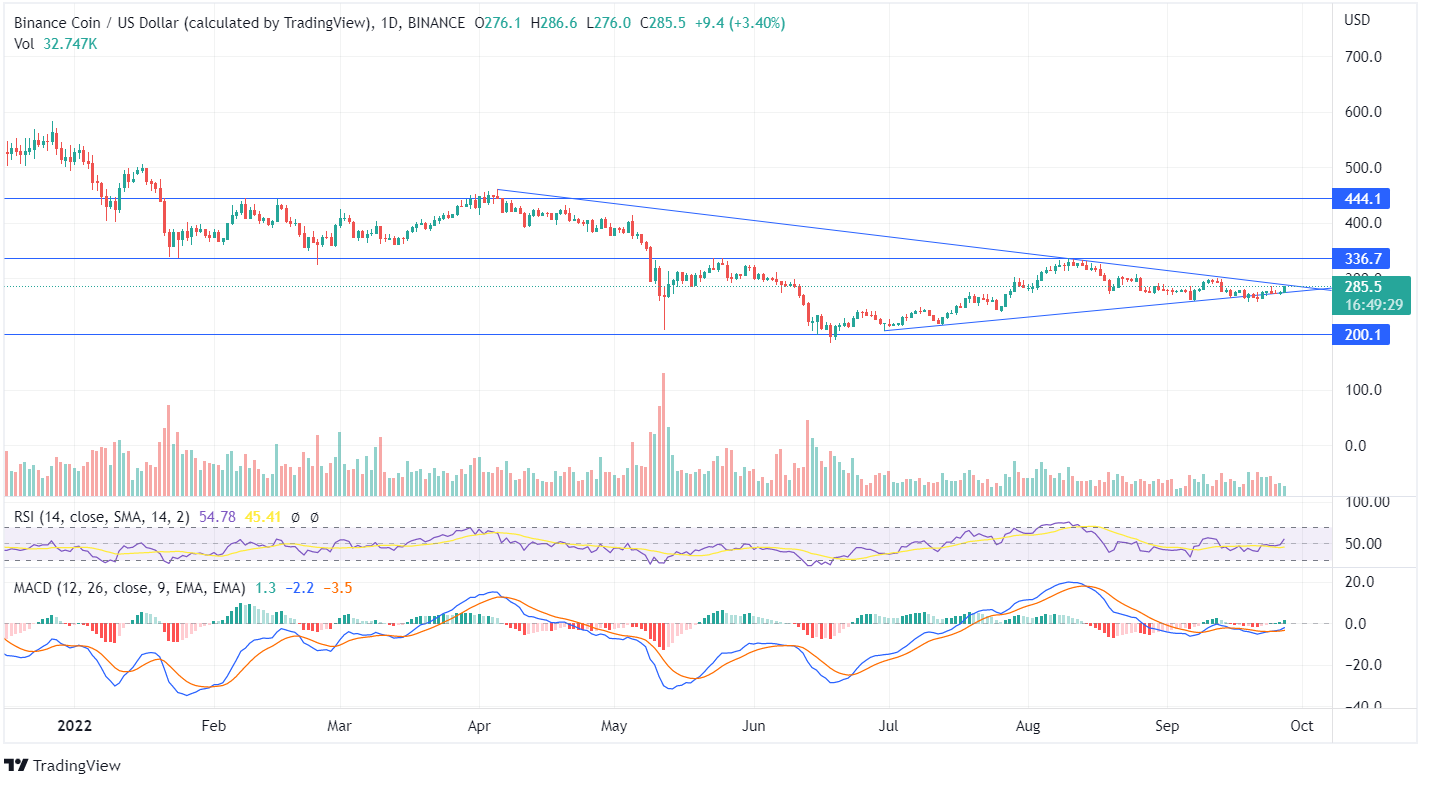
BNB shows a sideways move as there has been a minor price undertaking with the current value of $285.5. The BNB crypto showing consolidated momentum indicates both bulls and bears were unable to take any major price action.
Though BNB crypto reached its resistance of $336.7, the bulls couldn’t ascend the price further. BNB currency trades below the downtrend line, and the forming bullish candle is about to hit the trend line.
Once the price of BNB closes above the downtrend line, an upside move can be expected. The forming bullish candlestick closing above the recent highs can be a good opportunity for bullish investors.

The RSI indicator is 54, and hinting upwards indicates that the BNB token may head towards the overbought zone. The unfavorable volume bar towards the bears and the bulls requires additional traders.
The BNB coin has been in the bullish zone for the past few weeks in the weekly chart, and there has been a decent price movement during the previous week. The forming weekly candle is moving at a crucial point between the up-trend and the downtrend line, and if the price of BNB continues to support the up-trend line, it may reach its resistance point.
The weekly forming candle getting tested at the downtrend line needs immense support from the bulls for a bullish trend. If the price reaches the high of $336 and closes above it, the token may reach higher highs in the upcoming days.
The investors should wait for the forming candles to confirm an upcoming trade as the price is moving at the vital point between the trend lines, giving a neutral indication of the future price movement.

