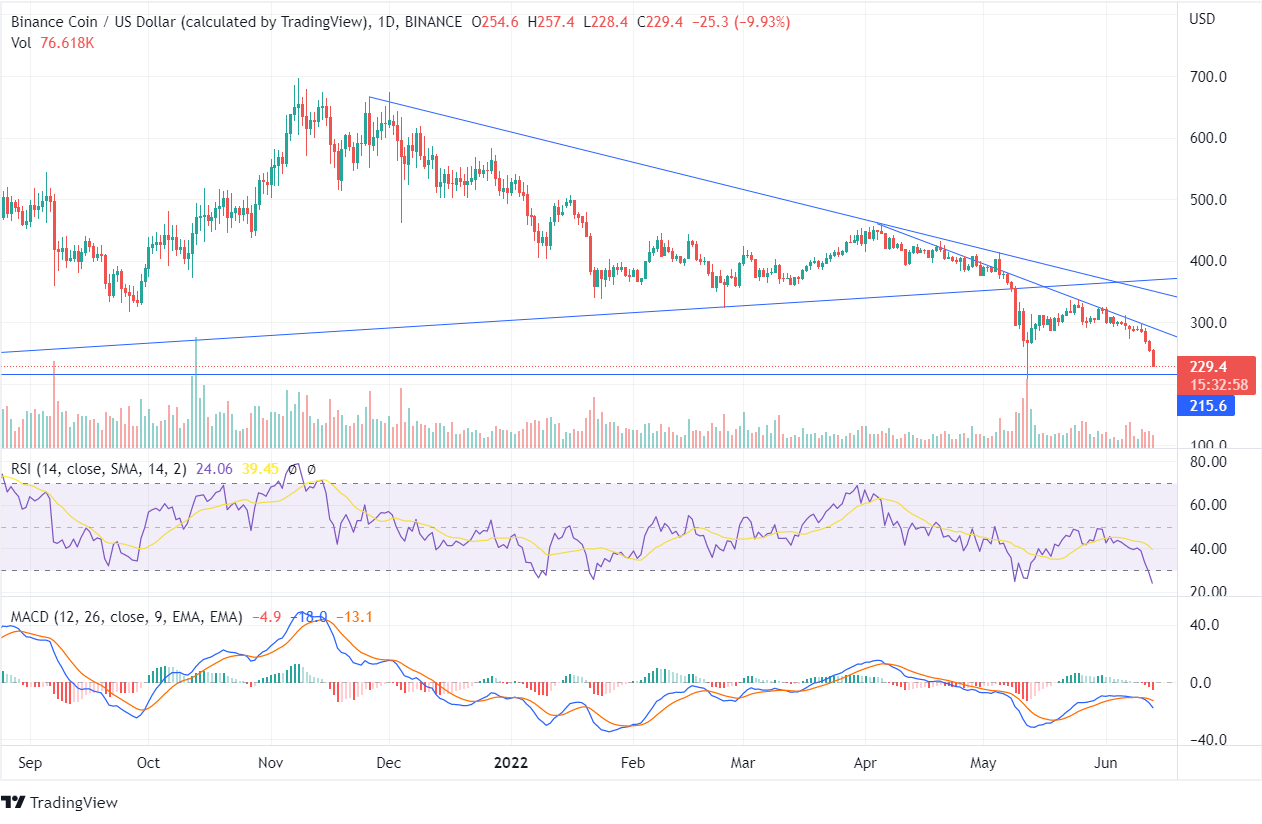
BNB has been forming lower low peaks as the token constantly declines from its high of $690 and is currently moving at the price of $232.5. The price is moving in the descending pattern below the downtrend line, and the price though got tested at the trend line but failed to mount up and moved towards its lower zone. The bears have hard-pressed the price down as on June 12, the token reduced by 7%, and the forming candles also show a strong downside move.
In the last few days, the candles have been forming lower lows pressurising the price towards the support line. BNB has recently entered the oversold zone with the RSI indicating 25. The token may turn around from the oversold zone towards the overbought zone if the bulls show positive sentiments and move the BNB price in an upward direction.
The coin is almost about to reach the same level from where a major price rise happened in the past, and the price reached its highs. The volume bars show support for the bears as the BNB price continues to deteriorate. The MACD line is below the signal line, which denotes a bearish signal, and the price had already reduced massively. The bulls can expect a trading opportunity if the BNB coin turns from its support and the price closes above the oversold zone.
On the weekly chart, the price is moving at the edges of the downtrend line and thought the price got tested several times but has failed to close above the trend line. The weekly chart shows the coin is about to enter the oversold zone as the price is about to reach its 52-week low. The previous week’s candle shows a downfall of 24%. The traders should wait for the token to reach $215, from where a turnaround can be expected or if the price closes below $215, a bearish momentum can be expected to continue in the long run.


