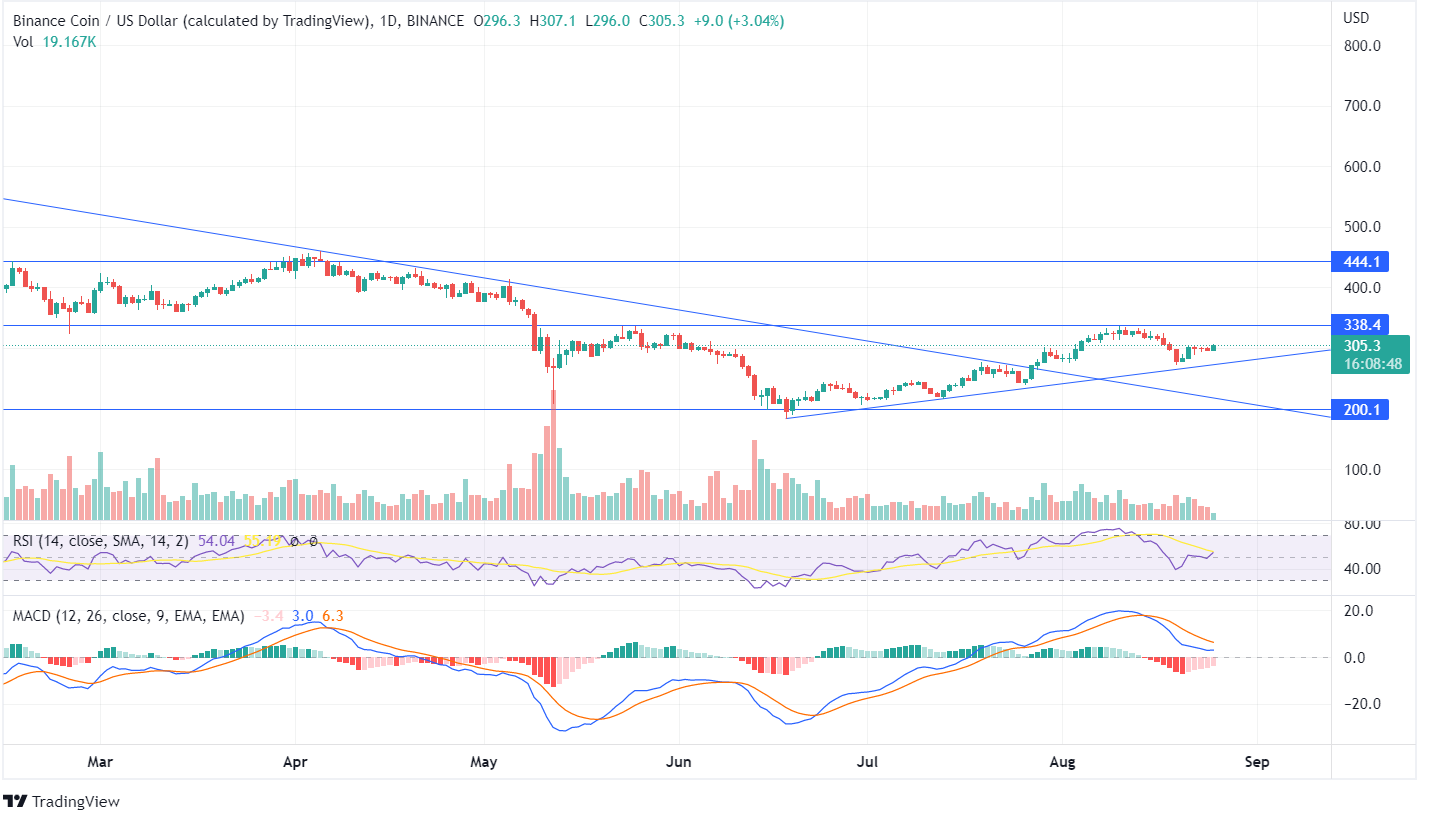
BNB has been reflecting a sideways trend for the past few days; however, recently, the price began to recover, taking the support of the up-trend line. The price is moving in a sideways channel between $338 and $200, with the current price of $305.3.
The bulls tried to close the BNB price above the highs of $338 in August several times but failed, and the price descended. Once the price hits $338 and closes above it, a strong bullish momentum can be expected in the long run. BNB, like other cryptos, had constantly been declining till June, after which the bulls showed positive sentiments.
The BNB price recently entered the overbought zone as the price was mounting up, and currently, the RSI at 54 shows neutral price action. The indicator line hinting upside may give the bulls a trading opportunity. The MACD line has been below the Signal Line for the past few days, and the histogram shows diminishing red candles.
The price of BNB has already declined significantly from when the MACD gave a sell signal. The volume bars show neutrality between the bulls and the bears as the volume being below average forms indecision about the upcoming price action.
On the weekly chart, the candles suppressed the long stretching downtrend line from November and showed a hike in the price as the BNB coin turned from its lows. During the last week’s candle, there was a huge price fall.
The indicators in the weekly chart of BNB indicate a bullish signal. However, the traders can wait for the token to close above the immediate resistance for a long-term investment.


