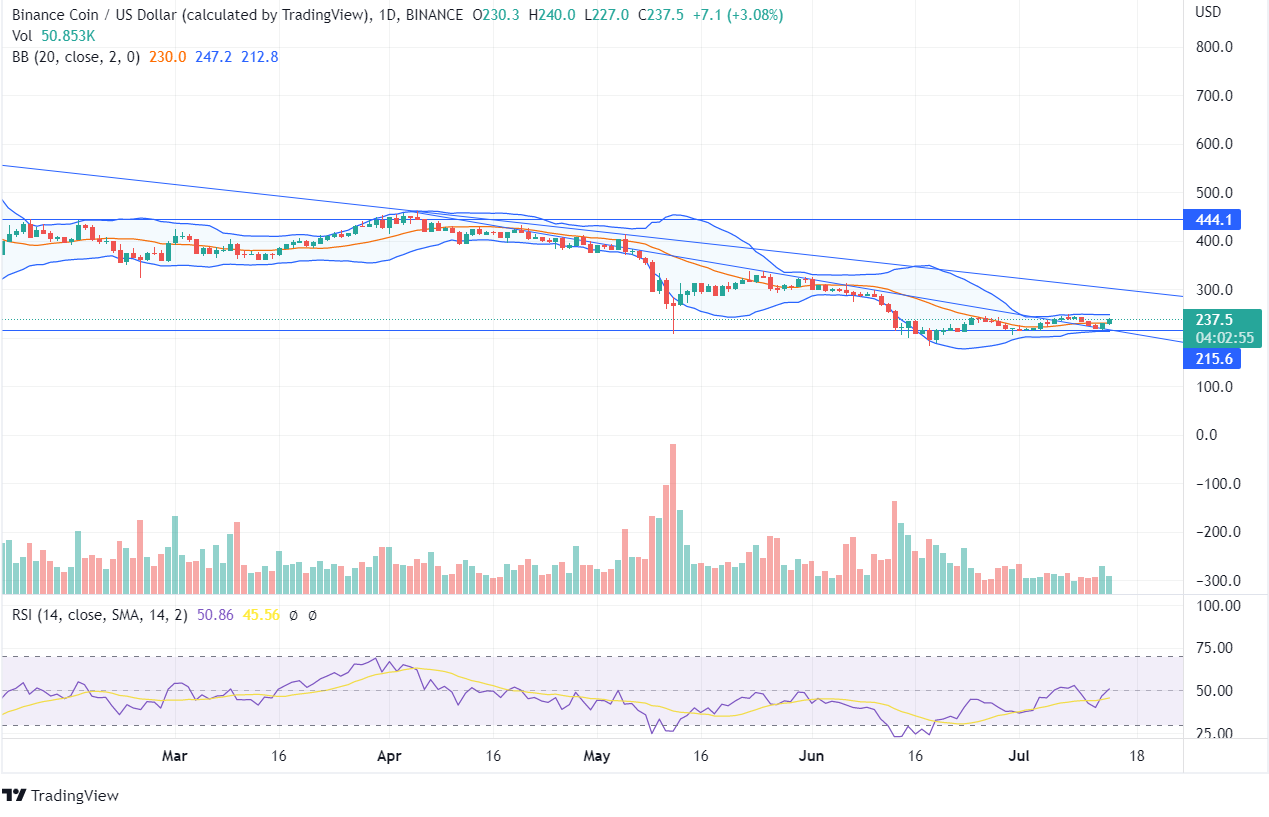
Binance Coin (BNB) has been moving in descending pattern as the price falls from its peak of $696 toward the support zone. The token is currently moving at the market price of $237 after constantly rejecting further downfall below the support line of $215.
On July 13, the bulls pushed the price of the BNB coin upside with a hike of 6%. The price suppressed the downtrend line, and once the price closes above the last high of $247, a bullish opportunity can be expected. During the previous day’s session, there has been the formation of a bullish engulfing pattern, giving the bulls an indication of an upcoming uptrend pattern. The token entered the oversold zone, but the indicator took a turnaround towards the resistance.

In the weekly chart, the previous four weeks’ candles are heading in the sideways pattern moving within the parallel range. The previous week’s candle has been profitable for the bulls as the BNB coin price increased by 15%. The price moving sideways shows indecision between the bulls and the bears. The investors should wait for the price to close above the recent high for a bullish trade or below the recent low for a bearish trade.

