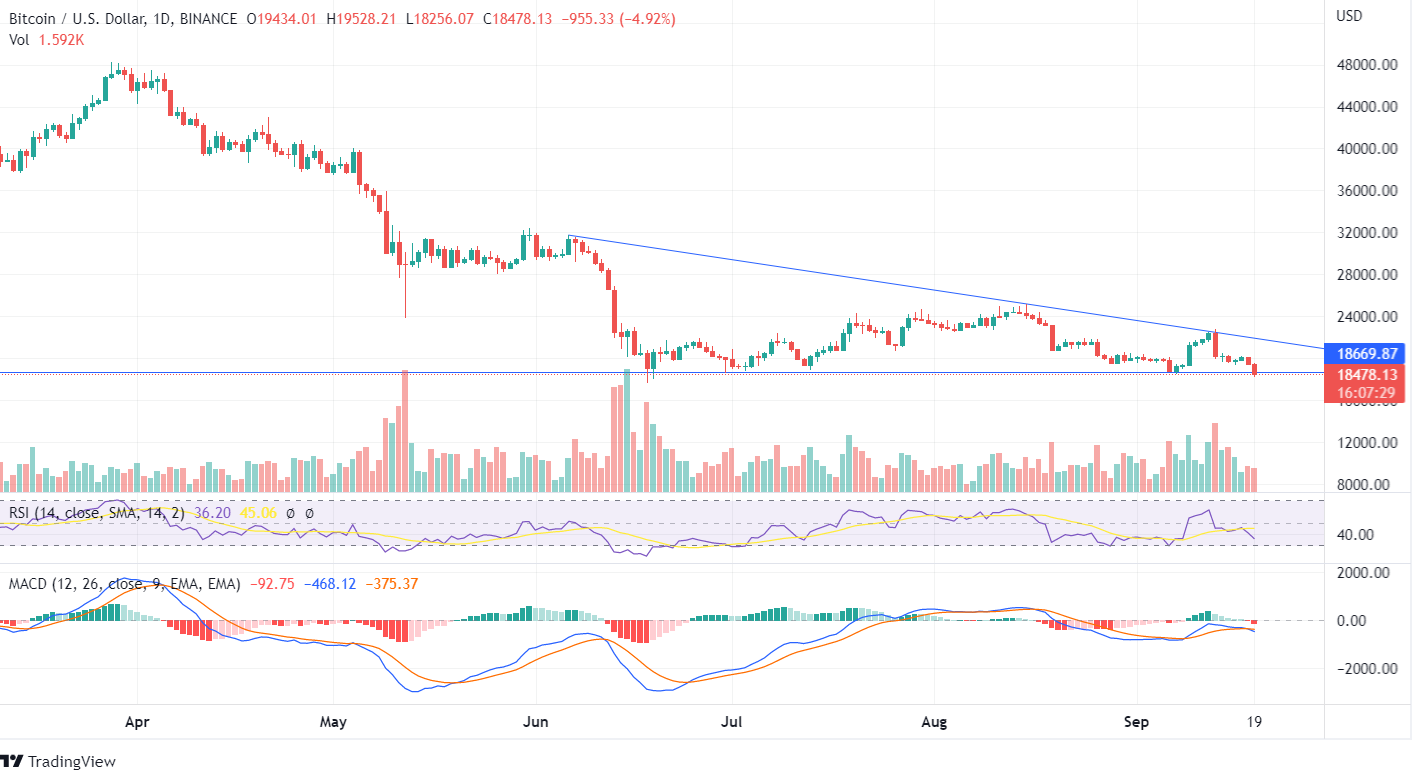
Bitcoin moves below the downtrend line as the price forms a lower low with the current price of $18,669. On September 18, the price declined marginally, and the forming candle showed a further decline as the price revolves around the support zone.
The price of Bitcoin was tested at the downtrend line but couldn’t close above it, indicating a bearish trend. A bearish engulfing pattern formed as the BTC price hit the downtrend line and began to fall. If the forming candlestick closes below the downtrend line and the bulls don’t push the value upside, a strong downtrend momentum can be expected in the long run. Read our Bitcoin predictions to know the future price projections of the token.
The MACD line has recently begun to move below the Signal Line, and the histogram chart shows red candles confirming a bearish move. There was a supportive volume of bears on September 13 when the BTC price significantly declined while hitting the trend line. The RSI indicator is currently 36, and the indicator tilting downwards indicates that Bitcoin may enter the oversold zone if there is a continuous formation of bearish candles.
The previous week’s candles show a huge fall though the bulls tried to push the value upside but couldn’t, and the bears took the price to its lows. The RSI indicator is about to enter the oversold zone on the weekly chart. The bulls need to show a sturdy positive sentiment for an upside trend, and the Bitcoin price needs to close above the recent highs while supressing the downtrend line.
In the 4-hourly chart, the price of BTC has closed below the long-stretching weekly and daily support line of $18,669. However, if the forming candle closes below the last low of $18,256 in the 4-hour chart, a strong bearish trend can be expected.


