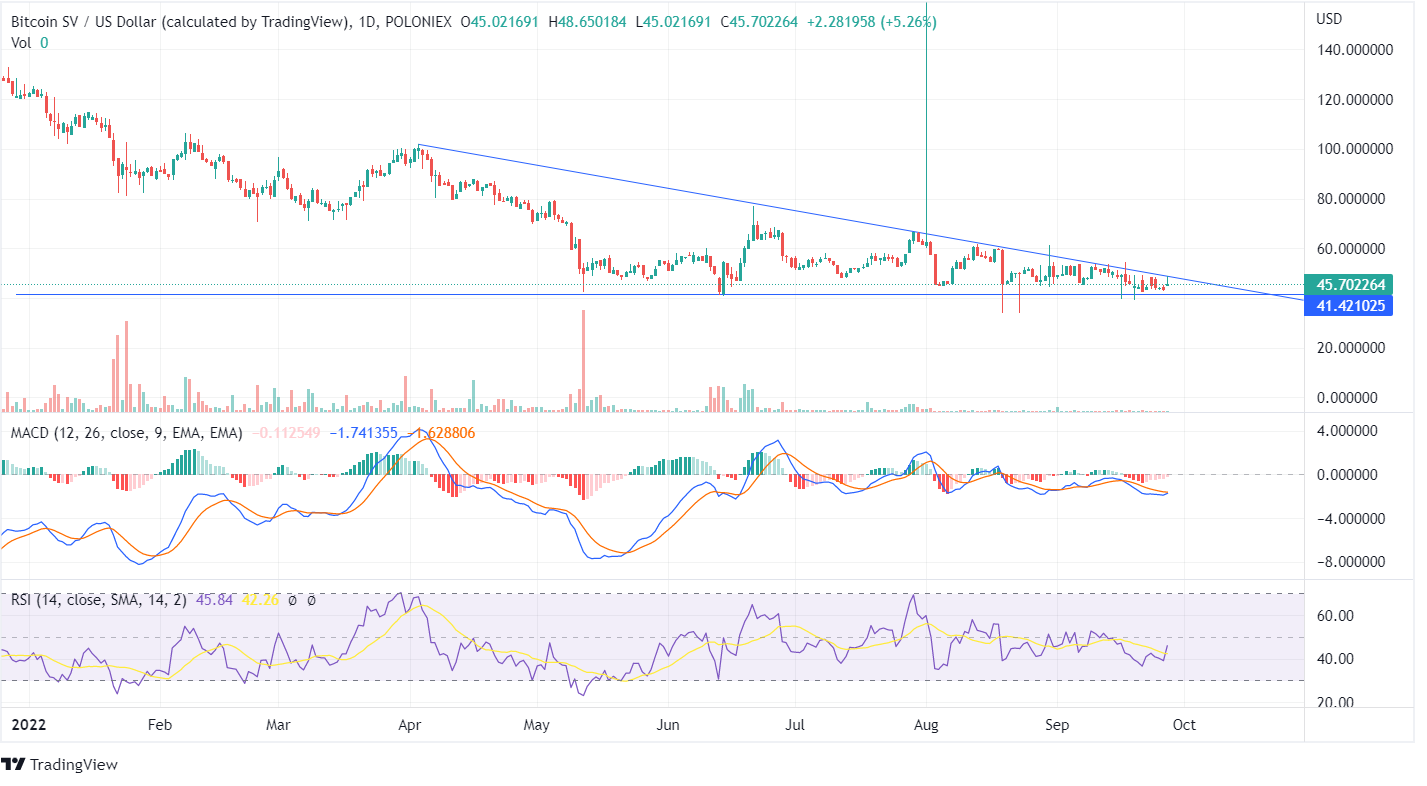
Bitcoin SV moves with negative momentum between the downtrend line and the support line with the current market price of $45.70. The forming candle gets tested at the trend line as the bulls try to push the price upside but are yet to close above it.
In the last few days, the BSV token has been moving sideways in the last few days with minor price movement. On August 1, the bulls pushed the price high to higher highs, but on the same day, the Bitcoin SV token fell drastically to its lows of $60. The RSI indicator is at 45, and the indicator line tilting upwards shows the BSV coin may head towards the overbought zone.

In the weekly chart of Bitcoin SV, the price is getting tested at the trend line, and the bulls tried to hit the trend line but turned back. The token showed a decent price movement, and neither the bulls nor the bears could push the price in any direction.
The BSV token has been in the bullish zone for the past few weeks; however, the price couldn’t show a rise. The previous week’s candles also got tested at the support line, but the Bitcoin SV price failed to close below the support line, thus showing a rejection for the continued downfall.
The investors should wait for the forming candles as those suppress the trend line or continues to move sideways, indicating an upcoming movement.

