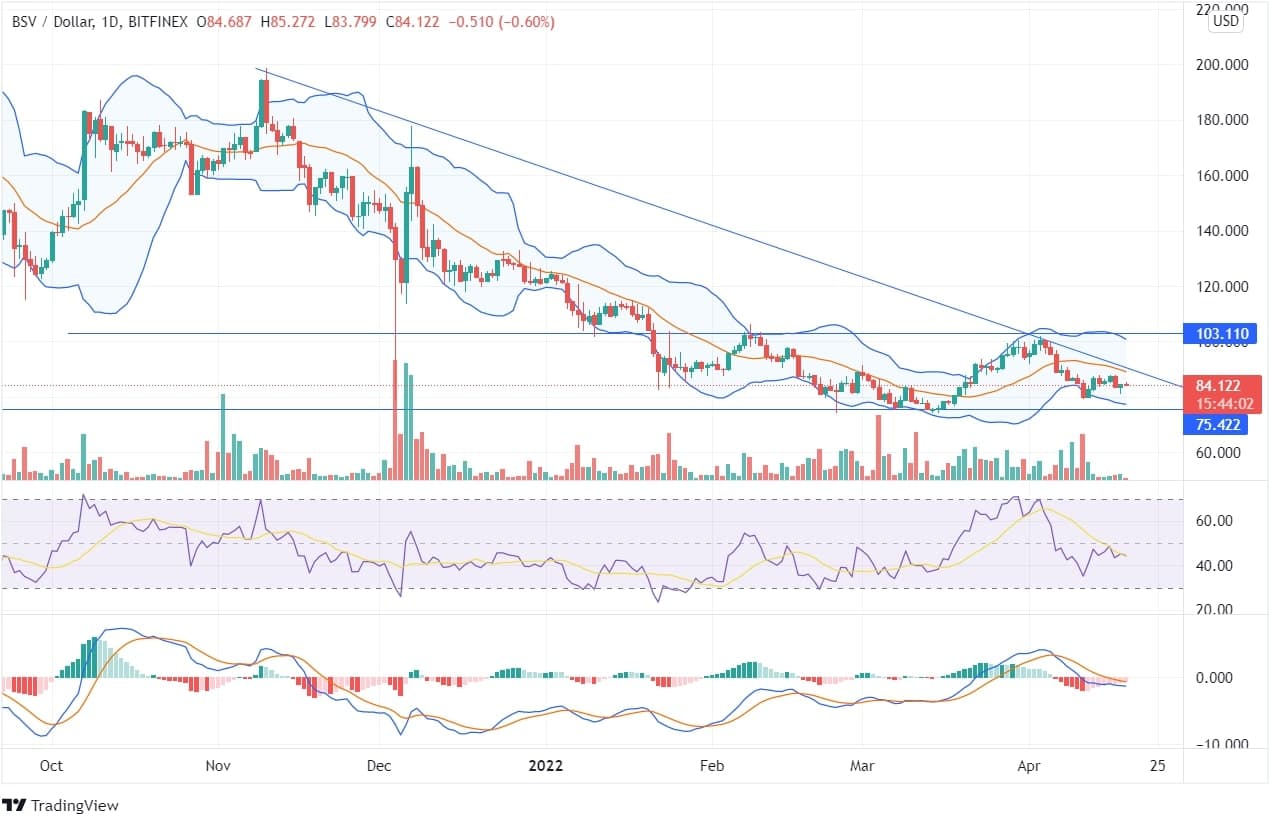
Bitcoin SV (BSV) has moved from its highs to its lows, forming lower low peaks. In the last three months, the coin has been moved in between the price range of $103 and $75. Yesterday, the token marked a moderate rise, but it still trades under bearish pressure. The coin price is moving below the downtrend line, and a robust price movement can be expected once the BSV coin closes above the resistance line or below the support line.
On the daily chart, the MACD line is below the signal line. However, the price of Bitcoin SV had already declined considerably. The RSI being at 44, is currently neutral but may head towards the oversold zone from where it may be turnaround towards its resistance. On April 12 and 13, the candles got closed below the lower Bollinger band, and the price trailing in between the bands can be a sign of rejection for the upliftment of the BSV price, and it may move towards its lows.
If we look at the longer timeframe, the coin price is moving at the same position from where it ascended during the past. However, if the bulls continue to push the Bitcoin SV price up once it reaches its support zone, a robust bullish momentum can be expected in the long run. Once the BSV price closes above the resistance of $103, it can be an opportunity for the bulls to hold the coin for a long-term profit.


