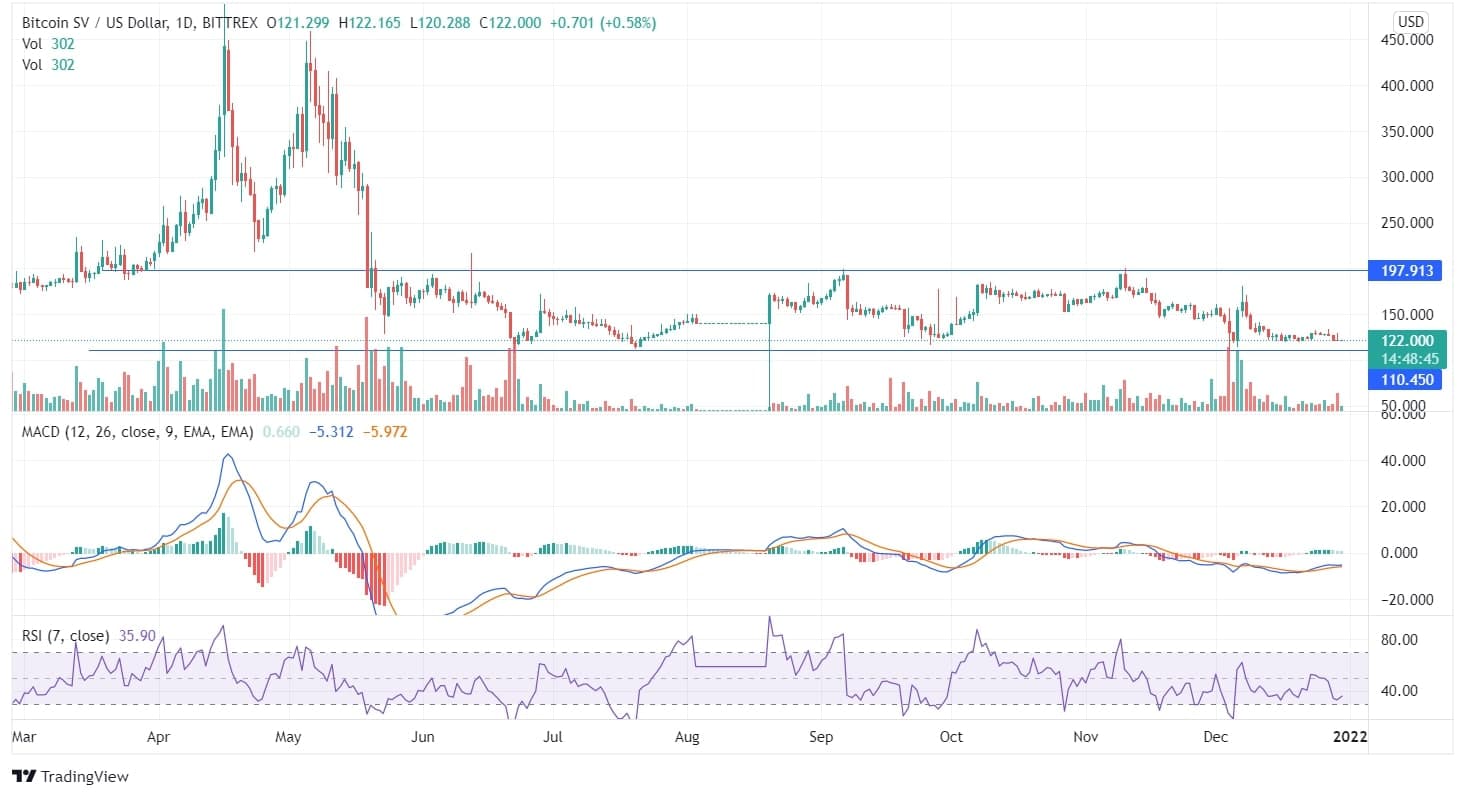
In the second half of 2021, Bitcoin SV (BSV) moved sideways in the price range of $197 and $110. It is currently revolving at the price range of around $122, from where it mounted upside and reached its high of $489 in mid-April.
In recent days, the coin hardly showed any price movement, and neither the bears nor the bulls could take the price in any direction.
The price is constantly trailing between peaks and troughs. Any major price action depends on when the coin suppresses the support or the resistance line, and the price closes below or above it. The price got tested several times at the support and the resistance line but failed to form any higher highs or lower lows.

Traders should wait for a progressive opinion. The RSI at 36 is presently neutral, and it may head towards any of the directions. The volume is also not screening any favorable decision between the bears and the bulls. In the current scenario, the investors should take their decision cautiously and be calculative towards their risk and reward.
On the 7-day chart, technical indicators are in the bearish zone, and the price is expected to fall towards the support line of $107. The bearish candle of the current week has still not broken the previous week’s lows and is currently moving at $122.
The upcoming price action and the investor’s decision depends on whether the coin closes above the low of the previous week’s candles and the price turns around from this point, or it continues to decline further. In the weekly chart, if the price breaks the support line of $107, it may reach a minimum target of $80.

