

The crypto market witnessed a bloodbath in the last week of February as the broader market plunged amid Trump’s decision to implement tariffs on Canada and Mexico and curb Chinese investment. As a result, the Bitcoin price fell over 10% in the last 48 hours to hit $86,264 with massive liquidation and breakdown from key support. Here’s what could happen next.
Key Highlights:
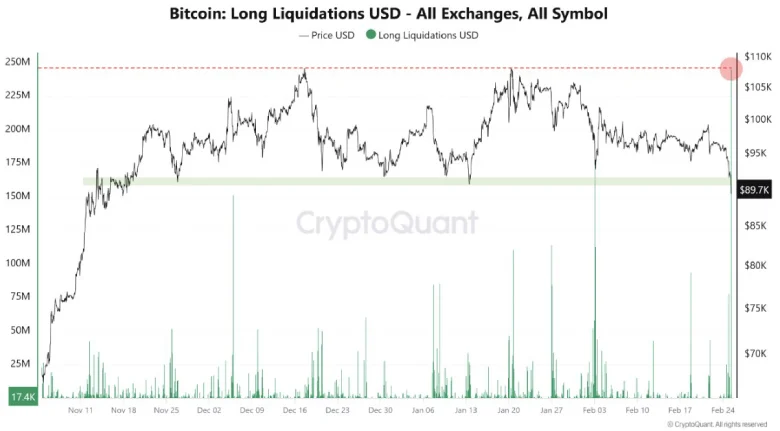
- Bitcoin’s large-scale liquidations have thinned the order book depth, reducing market liquidity and increasing volatility.
- A double-top pattern, signaling a distribution phase in BTC, signals a drop to $75,000.
- The $91,500 level stands as a key resistance for buyers to break and invalidate the risk of an extended correction.
BTC Faces Largest Long Liquidation Since November
Over a month, the Bitcoin price has witnessed a notable correction from $109,350 to $86,739, accounting for a loss of 20%. The latest price drop has sparked a wave of liquidations, with long positions worth $245 million being wiped out—the highest level since November.
Such large-scale liquidations often lead to thin order book depth, increasing the chances of price rebounds even in low-volume trading conditions. This means as order book depth is low, even a small buy order can push the price up rapidly, suggesting a relief rally.
The daily chart shows the average directional index (ADX) slope has surged to 35%. While such high value hints at the strength of a particular trend, if may lead to an exhausted momentum if the trend prolongs for long.
Thus, the BTC may soon witness a bullish rebound in the coming weeks to stabilize its price and set the next direction while the overall outlook is bearish.
Double-Top Pattern Sets Bitcoin Price Correction to $75,000
An analysis of the Bitcoin technical chart shows the formation of a double-top pattern. The chart setup displays two major reversal price reversals as an ‘M’ shape and leads to a major breakdown below key support.
With today’s 5% down, the price broke the $91,500 neckline and plunged below the $89,000 level after three months of consolidation. However, with the 200-day EMA slope guarding the $86,000 level, the coin price could witness a short pullback, coinciding with the aforementioned theory of relief rally.
If true, Bitcoin could retest $91,500 as resistance to validate its sustainability for a lower price. Thus, the post-breakdown fall could plunge the asset 14% down to hit $75,000.
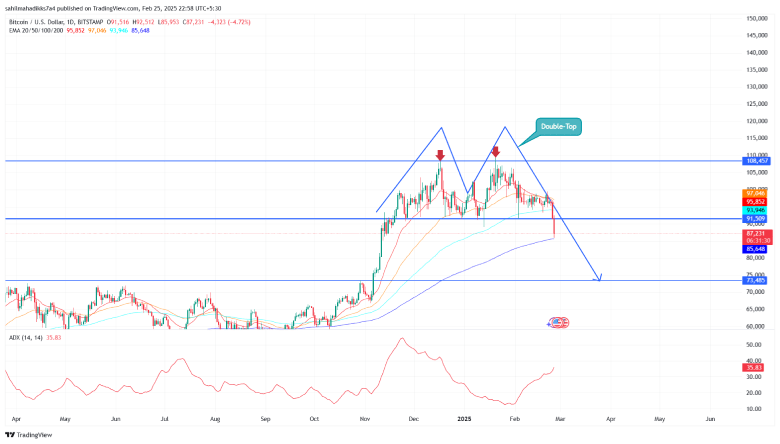
On the contrary, the price surging above $91,500 could weaken the seller’s grip and invalidate the thesis of an extended correction.
Also Read: Du Jun on Infini Attack: $50 Million Loss is an “Entry-Level Trial-and-Error Cost”
