

During Wednesday’s trading session, the Bitcoin price surged 3.6% following the Federal Reserve’s decision to keep the interest rate unchanged. The market reacted positively to this announcement with BTC teasing a bullish breakout of $85,000 and breaking the week-long slumber. The daily chart analysis shows this renewed recovery could push the price beyond the boundary of the current correction trend, offering buyers an opportunity to accumulate. Is a $100k comeback close?
Key Highlights:
- Bitcoin price surged following the Federal Reserve’s decision to keep interest rates unchanged at 4.25%–4.50%.
- Since late January 2025, the Bitcoin price has resonated within two covering trendlines, indicating the formation of a falling wedge pattern.
- A potential death crossover between the 50-and-200-day Exponential Moving Average will accelerate the market selling pressure and extend the current correction trend.
Federal Reserve Keeps Interest Rates Unchanged
On Wednesday, March 19, 2025, the U.S. Federal Reserve decided to leave interest rates unchanged, maintaining the current range of 4.25% to 4.50%. Federal Reserve Chairman Jerome Powell remarked that while inflation concerns persist, there are no immediate plans to alter the rate.
He emphasized that the economy’s growth is expected to be slower than previously projected, with the latest growth estimate pegged at 1.7% rather than the earlier forecast of 2%. Powell also pointed to the continued risk of inflation, as U.S. tariffs could delay efforts to reduce price pressures.
The decision to hold rates steady was largely anticipated by the market and analysts expect two rate cuts in 2025, driven by persistent inflation and slower-than-expected economic growth.
Following the Fed’s decision, the crypto witnessed a bullish turnaround, with altcoins seeking suitable support levels for bottom formation.
Bitcoin Price Nearing Major Breakout in Reversal Pattern
In the last two weeks, the Bitcoin price witnessed a bullish reversal from $76,600 to $86,500, accounting for a 13% surge. This recovery in the daily chart reverses a bull cycle within the formation of a falling wedge pattern.
Historically, each reversal from the bottom support has bolstered buyers with renewed recovery to challenge overhead resistance. Thus, the BTC price could surge another 4% to challenge the downsloping trendline at $90,000.
A potential breakout with daily candle closing will signal the end of prevailing correction and set 20% upswing to reach new all-time high.
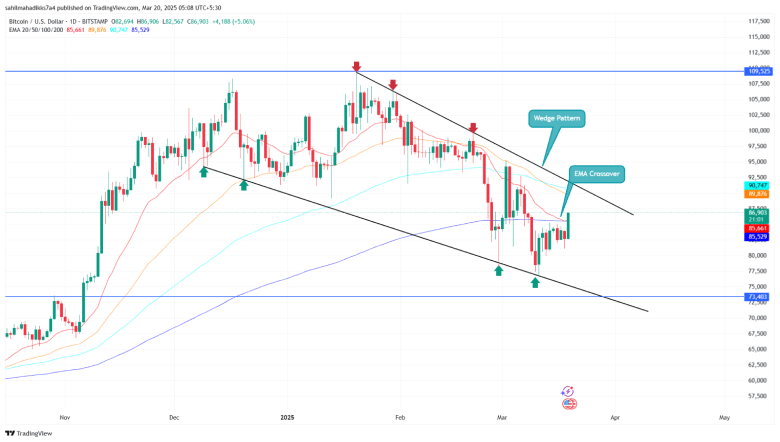
Alternative, if the sellers continued to defend the wedge pattern resistance, the current correction will extend till April 2025.
Also Read: First-Ever Solana ETFs Launches Tomorrow; Will SOL Price Breakout?
