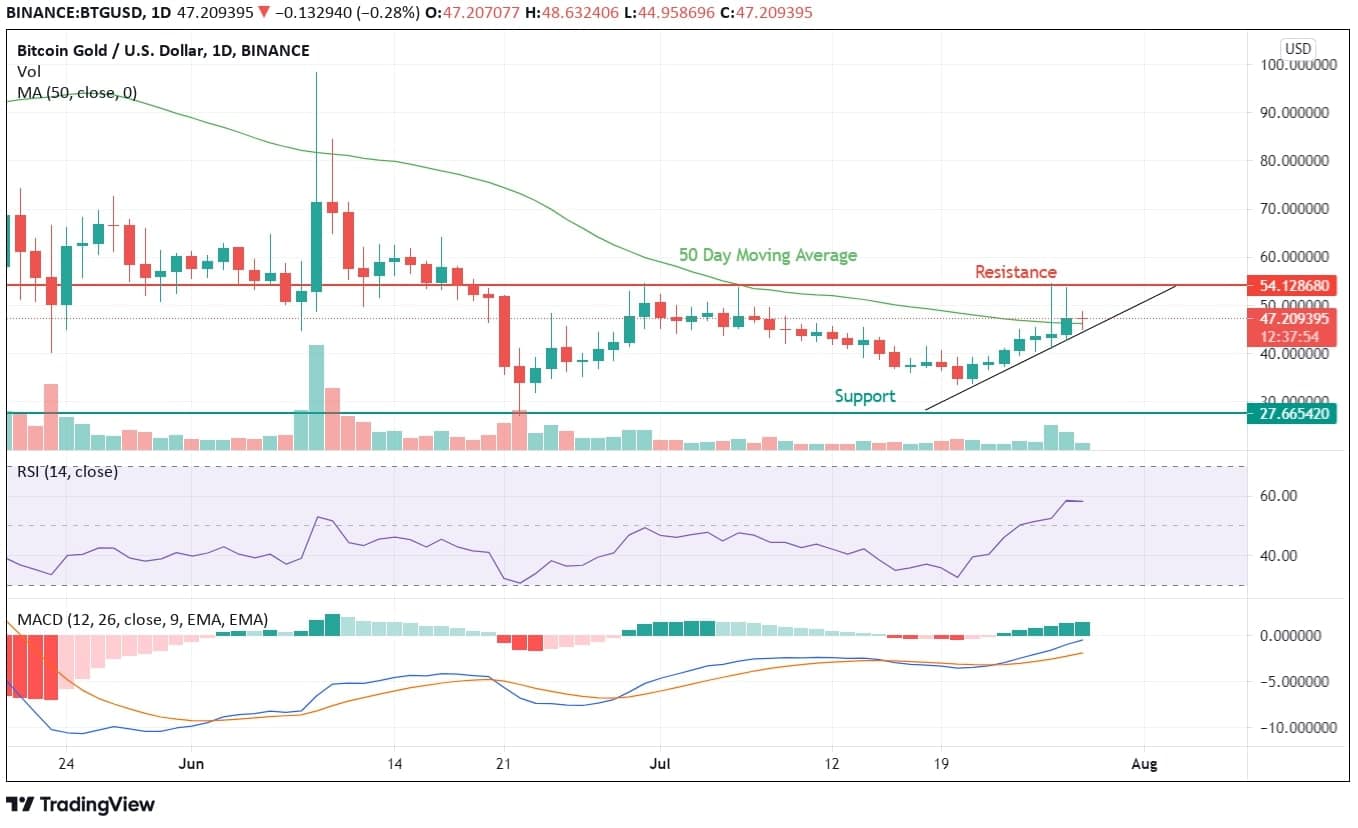
After coming into existence after the hard fork on the Bitcoin blockchain, Bitcoin Gold hasn’t looked back until the profit booking led to the crash in May 2021. We have witnessed BTG’s fall from the highs of $172 it hit in 2021 to lows of $45 on June 22, 2021. After more than one month of negative consolidation, BTG has finally come back into bullish existence.
Bitcoin Gold Price Analysis
As visible on charts, Bitcoin Gold is trying hard to cross the $55 resistance for the last two days, but each attempt is being pushed back from the levels creating a wick on daily candle charts. Crossing its short-term moving average of 50 days indicates some bullishness in this counter, but will it be enough to push BTG above $55 levels. This pushback has been a consistent event, but MACD indicates a bullish swing, and RSI closing towards overbought zones can push BTG’s price towards $60 in a short duration.
Investors can make a 50% investment at these levels and average out if BTG falls below the trendline and wait for another swing to push back the prices to new highs. Once it breaches the $55 resistance, one can wait for triple-digit targets.


