Bitcoin has become a popular investment option due to its potential for high returns, limited supply, and decentralization. With only 21 million Bitcoins, some see scarcity as a driving force behind increasing demand and prices. Additionally, the decentralized nature of BTC, means it operates on a network not controlled by a single entity providing users with more control over their assets.
The tokenomics of Bitcoin involves creating and distributing new Bitcoins through a process called mining. Mining involves solving complex mathematical problems to validate transactions on the network and add them to the blockchain, a public ledger of all Bitcoin transactions.
The reward for mining decreases over time as more Bitcoins are mined, following a predetermined schedule set by the Bitcoin protocol. The combination of mining and the limited supply of Bitcoins helps maintain the network’s stability and security and control inflation.
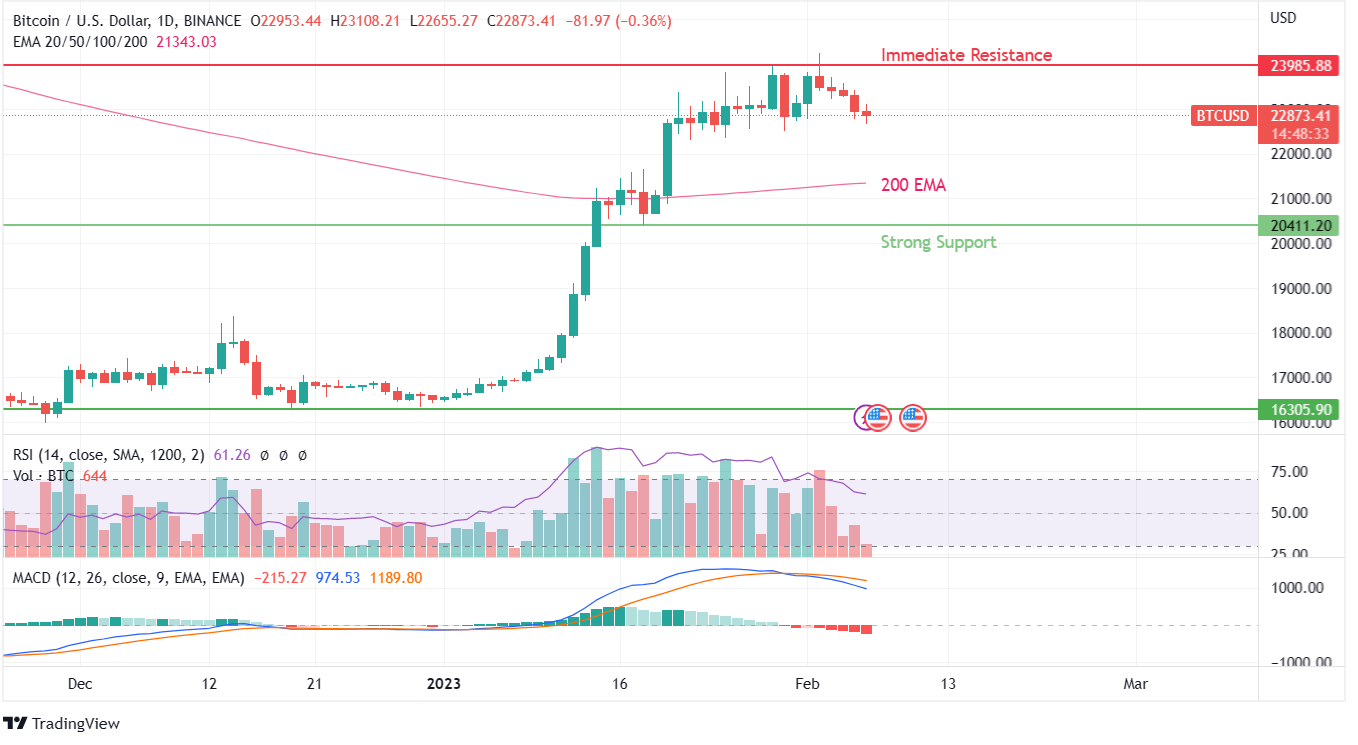
Bitcoin price action has reached a ceiling at $24000. Sellers are taking advantage of this higher valuation compared to the December end value of $16,300. The only short-term support from the currently dropping value is placed at the 200 EMA curve. Read our BTC prediction about whether the token can sustain the 200 EMA support or not!

Technical indicators such as RSI have shown a tumbling price trend, with the MACD indicator developing a bearish crossover pattern. The combined outcome of these two indicators showcases a declining transaction volume too.
A possible reason for this price action could be a slight profit booking after the immense positive movement seen in the last thirty days. The 200 EMA curve is still trading at a marginal premium from its currently traded value of $22,795. This outcome has also confirmed the presence of a tough and more expansive resistance zone between $24,000 and $26,000.

