

In the second half of February, the crypto market continued to waver in a sluggish trend, evidenced by Bitcoin consolidation around $95,000. Amid the market uncertainty, the lack of bullish momentum can be attributed to declining inflow from spot BTC ETF (Exchange Traded Fund). Will the waning institutional demand trigger BTC correction?
Key Highlights:
- Over the past three months, the Bitcoin price has shown a sideways trend, resonating between the $108,000 and $91,175 horizontal levels.
- Weak ETF demand threatens Bitcoin price for a potential correction.
- The $86,690 and $79,611 levels stand as key pullback support for BTC buyers as they coincide with 38.2% and 50% Fibonacci retracement levels.
Bitcoin Whales Accumulate $3.8B Amid Market Correction
The 2024 uptrend was significantly boosted by the massive inflow recorded on spot Bitcoin ETFs. The institutional demand for these financial instruments and growing global adoption pushed the BTC price to a new all-time high of $109,356 on January 20th, 2025.
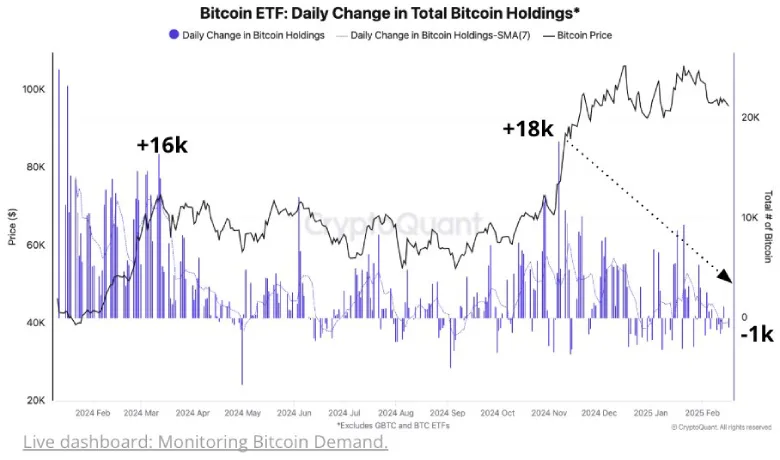
However, the report shows Bitcoin ETF inflows have slowed dramatically in recent months, trading concerns about the sustainability of the current market rally.
According to CryptoQuant, US Bitcoin ETF purchases have plunged from +18,000 BTC in early November to -1,000 BTC as of today, indicating waning institutional demand.
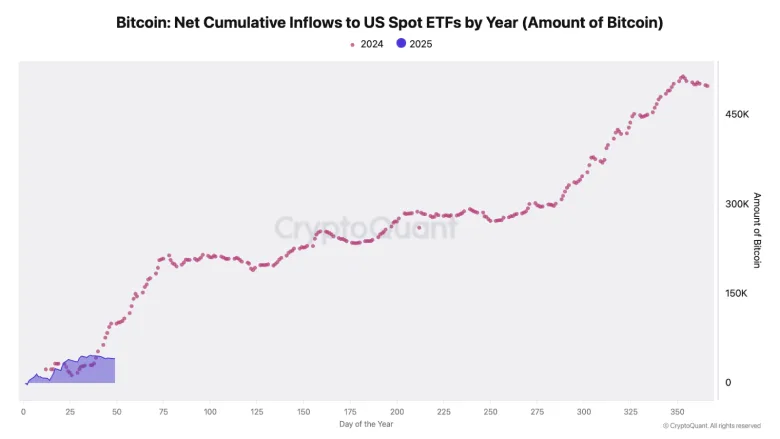
The slowdown is further highlighted by data from analyst Julio Moreno, which reveals that 2025’s net ETF inflows stand at 41,000 BTC, less than half of 2024’s 100,000 BTC at the same point last year. This sharp decline suggests that ETFs are not absorbing supply at the same pace, potentially limiting Bitcoin’s upside momentum.
Triangle Pattern Could Signal Upcoming Correction
Over the past two weeks, the Bitcoin price has witnessed a low volatility consolidation, wavering around the $95,000 level. The sideways action displays a neutral candle and price rejection on which side indicates no dominance from buyers or sellers.
However, the consolidation has started resonating within two converging trendlines, indicating the formation of the symmetrical triangle pattern. The chart setup is known to drive a temporary pause for traders before it restores its prevailing momentum.
With the current market uncertainty, a potential breakdown from the triangle support will signal an early sign of mounting selling pressure. This breakdown will gain further traction if sellers breach the multi-month support of $91,175 with a daily candle closing.
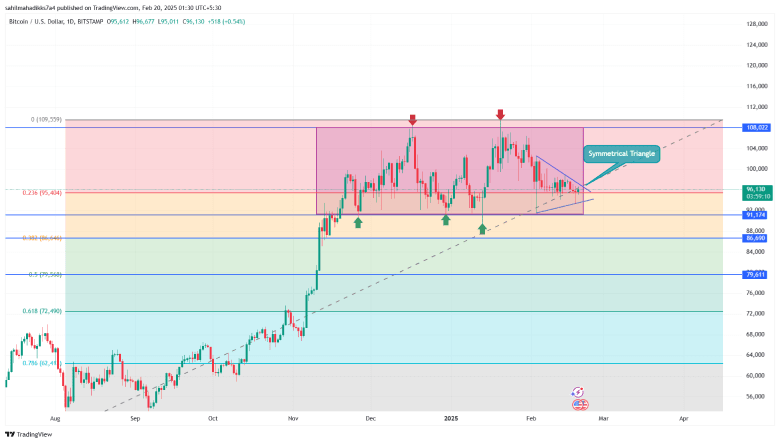
This post-breakdown fall could drive an extended downfall to $86,690, followed by $79,611.
On the contrary, if Bitcoin price defends $91,175, the current consolidation could be prolonged.
Also Read: Binance.US Restores USD Deposits & Withdrawals With Zero Fees
