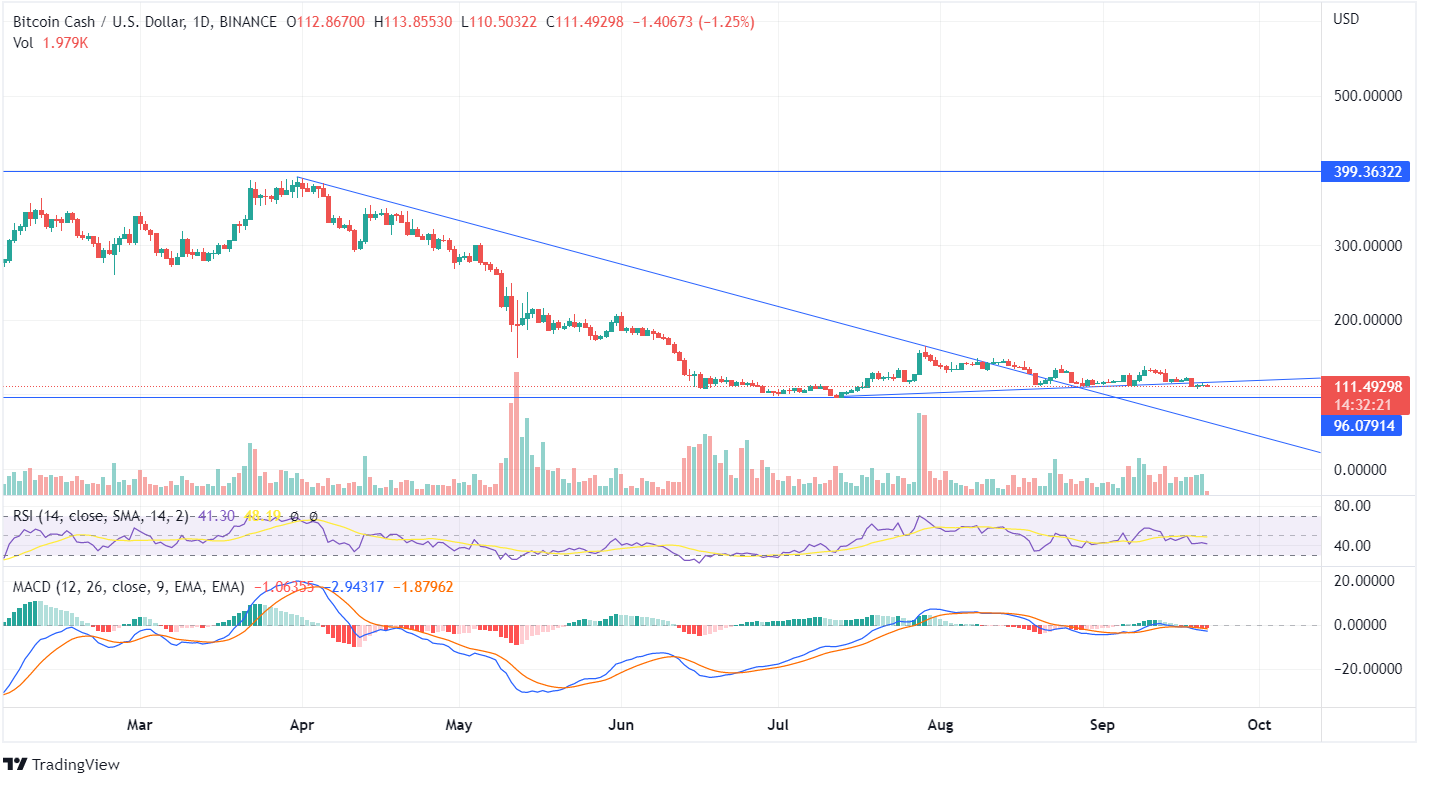
The daily chart of Bitcoin Cash (BCH) shows the price is heading toward its support while forming lower lows. The MACD is below the Signal Line, projecting a bearish trade till the price of BCH reaches its support line. Once the price reaches the support point, a turnaround can be expected as in the last 2 years; the Bitcoin Cash price hasn’t closed below the low of $96.07.
The unfavorable volume towards the bulls or the bears hints that the BCH investors should wait for the forming candles. The price was moving above the up-trend line; however, the bearish candle formed on September 18 closed below the trend line.
The Bitcoin Cash price started moving below the trend line, and now it may lead towards the low of $96.07. Read our BCH price prediction before you invest in it to keep your investment decision strong!
In the weekly chart, BCH revolves around its lows, with remote price movement showing consolidated momentum with the current market price of $111.49. The price of Bitcoin Cash was moving below the downtrend line, and though the token recently suppressed the trend line, there was a minor price movement showing indecision in the market.
The price not closing below the support line can be a rejection for further downfall. However, for an up-trend move in BCH, the bulls must push the price robustly upside. There was a huge fall in the previous week’s candle, and the forming bearish candle shows neither the bulls nor the bears can push the price.
The MACD line is ahead of the signal line, and the histogram shows green candles denoting a bullish trade. However, an upside momentum can be expected once the price of Bitcoin Cash closes above the recent high of $164.
The RSI indicator is at 33 and shows neutral price action, but the indicator line tilting upwards may head towards highs if the bulls show positive sentiments pushing the price upside. The volume candle moves below average, and additional traders are required for sturdy price movement in any direction.


