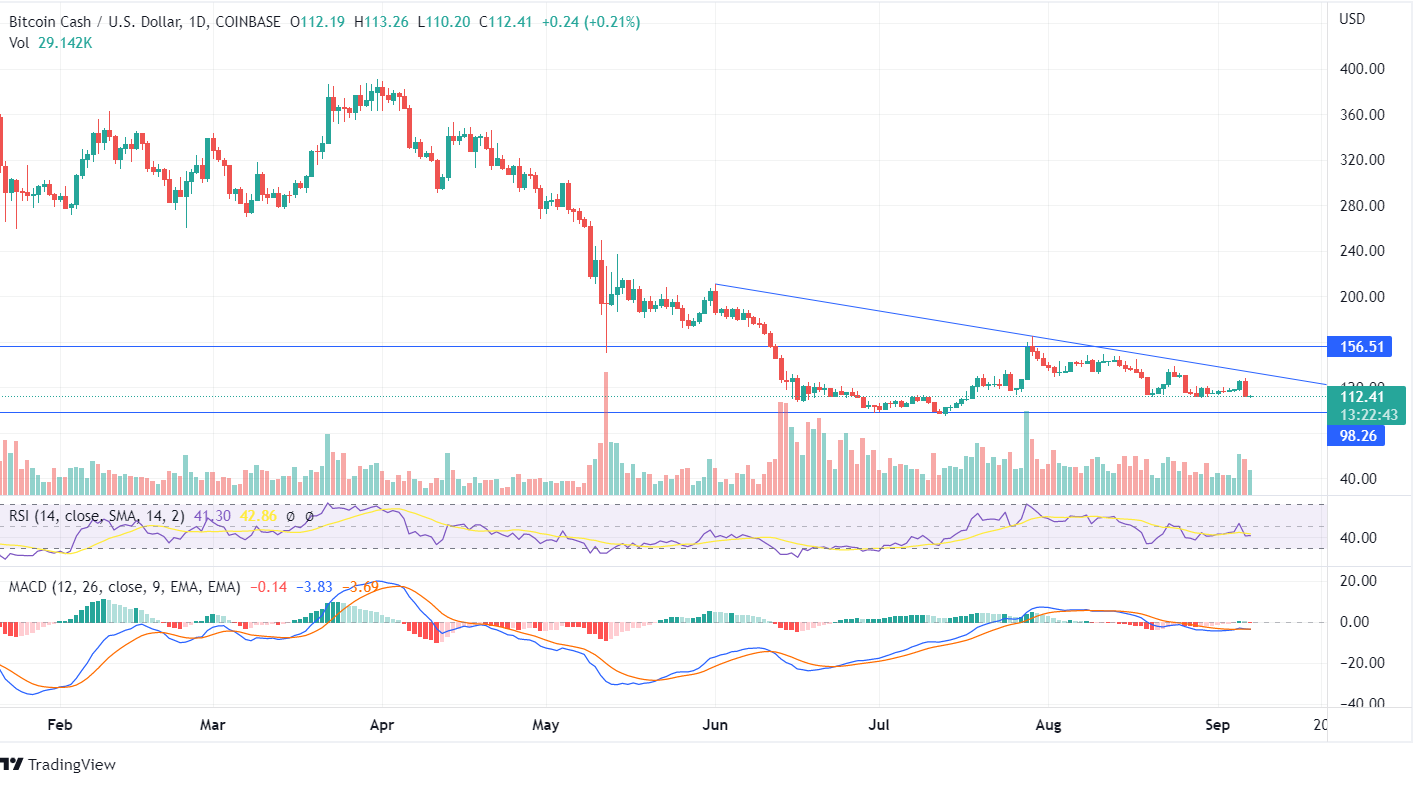
Bitcoin Cash is moving in its lower zone below the downtrend line with the current market price of $112.41. The token has constantly been forming a lower low, showing a bearish trend, and on September 6, the BCH token declined highly as the bears pushed the price down, and the token closed below the last day’s low.
There was a formation of a bearish engulfing pattern yesterday, and the price may continue to descend towards its support line of $98. It is interesting that the bullish candle formed on September 5 shows that the bulls tried to make an upside move along with the supportive volume but couldn’t close above the downtrend line, and on the next day, the bears overtook the price.
The MACD line and the Signal Line intersect, indicating indecision about the upcoming price movement. The RSI indicator is 41, showing sideways movement and neutral price action. The bears can expect a reduction in the price till its support, or if the price closes below the support line, a further downfall can be expected. Read our BCH prediction to know in which direction the price will move.
The price of Bitcoin Cash is getting tested at the trend line on the weekly chart and shows a descending pattern. Though the bulls tried to push the price upside but faced rejection, and a bearish candle is being formed. The RSI indicator has entered the oversold zone on the weekly chart and may continue to be there if the price falls.
If the BCH price continues to follow the downtrend line, a strong bearish momentum can be expected in the long run. The investors should wait for the price to reach the immediate resistance, at least as the token has been caged in a horizontal channel. Once the Bitcoin Cash candle breaks the channel and shows a movement in any direction, a robust trend can be expected in the long run.


