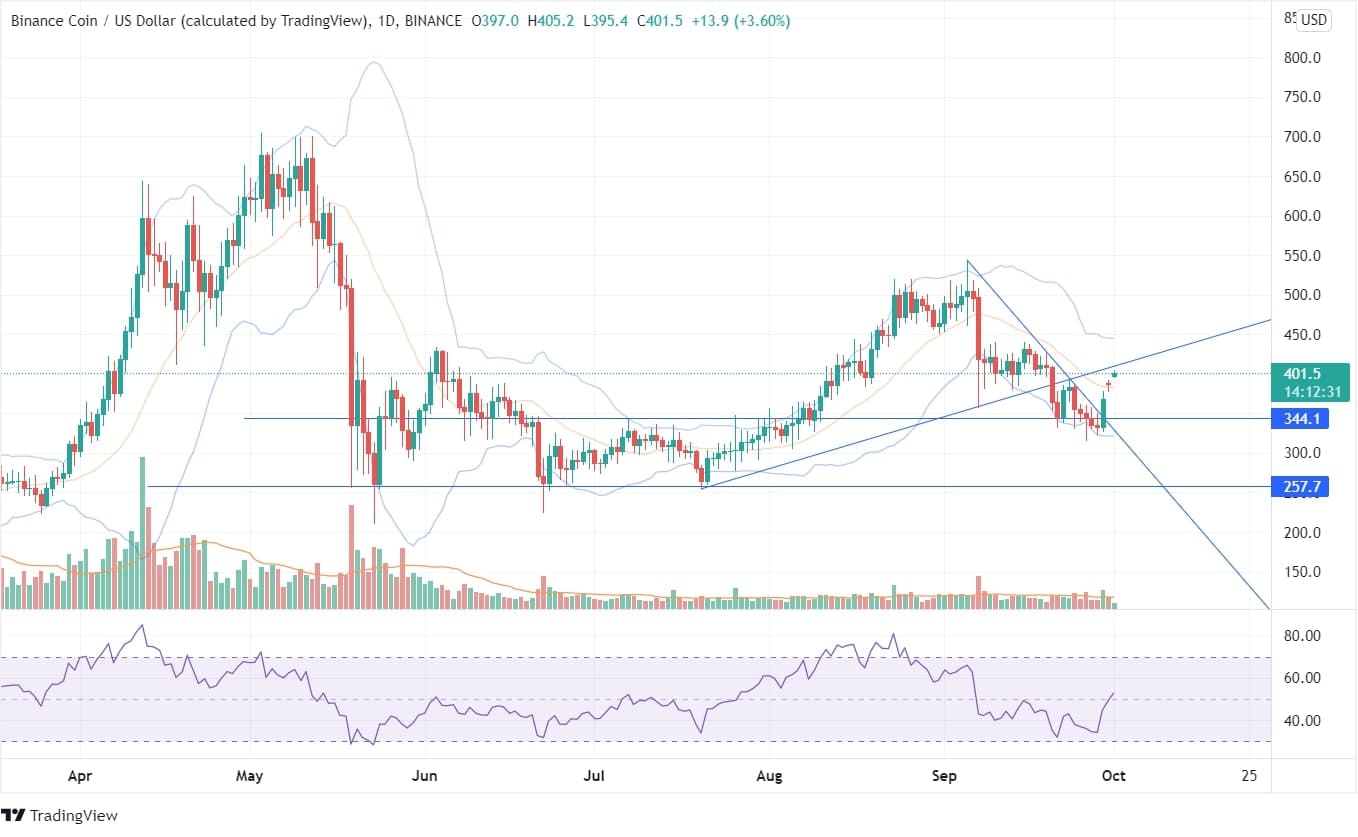
Binance Coin has taken a breather recently after being under strong selling pressure for the better part of the last month. The crypto had given away a tad more than 35% of its value from the highs of around $505 made during the end of the last August.
The bears finally started showing signs of exhaustion as prices came close to long-term support zones around $350-$300. A robust upward trendline on the longer duration charts was found to be of immediate and significant support; BNB started to stall and eventually found the strength to inch back to around $400 on the present day. A quick climb and strong support zones are indicative of possible reversal in the script.
Binance Coin being at the turnaround point after being rejected by the downtrend line seems to be a golden opportunity for the buyers. Further candlesticks are at the edge of the Bollinger bands, which acts as a considerable support level.
There is a formation of ascending triangle pattern along with the breakout of candlesticks. From July 21, there was a redundant growth of price from $348.2 to $524.9. It’s the rigorous point for premium price action. The volume indicates a rise in buying pressure after breaking its 35 days buyers’ volume in a daily chart.
The RSI indicator projects that the price has reversed from the oversold zone and is now in the neutral territory. The daily chart of BNB is observing a strong upside momentum with a huge buying pressure and is currently at 52.
The price of Binance Coin is currently trailing above the support zone after continuously breaking previous highs and is about to reach the uptrend line. The price is expected to shoot upto a minimum of $543.9, and if it outstrips that price, it may extend to $699.9.
Furthermore, the formation of Doji in the daily chart, creating indecision between buyers and sellers, has been suppressed by forming a bullish candle.
The BNB has seen a downfall in the last few days, but it appears that the currency may soon reach its peak as in the four hourly charts. Binance Coin is making higher highs and lower lows patterns, and the price took a shoot up with an immense buyers volume making the price rise from a low of $330 to a high of $399.5 in around two weeks.
There is a bullish divergence in the four hourly charts, followed by a strong bullish candle, crossing a strong trendline continuing from July 21. An immense hike is noticed in the volume of buyers in the hourly chart.
BNB coin has yielded a return of around 21% since the last week after a breakout in price on September 29.


