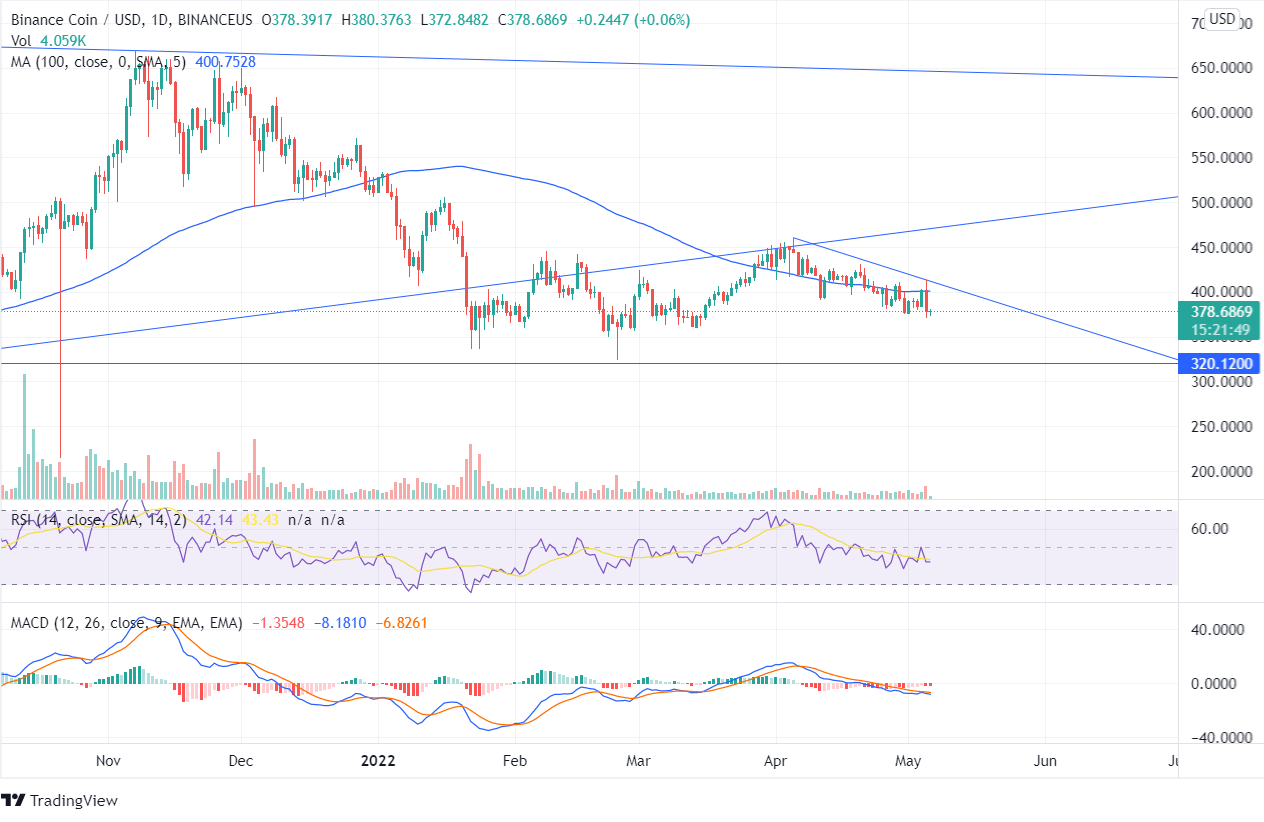
Binance Coin’s price reflects consolidation, which can lead further to a significant price movement. The coin price is currently trading bearishly. On May 05, the BNB coin got tested at the trend line but failed to breach, and there was a downfall of 11%. The BNB token has been moving in a consolidated pattern over the past several days with the current market price of $378.
The technical indicators on the daily chart show neutral signals. The MACD line moves below the signal from the past few days, and the investors can wait for a positive crossover. On the other hand, the RSI is around 41 and currently shows sideways momentum. The price of Binance Coin is moving below the 100-period moving average, and the bearish engulfing pattern formed yesterday can indicate the corrosion of value.
Moreover, the volumes of the BNB coin have been steadily declining over the past few candles indicating lesser and lesser trading activity over the counter. Prices have been under selling pressure, and demand for Binance Coin isn’t enough to support rising prices.
In fact, BNB had a slight upward movement to retest the lower line of the triangle. No upward direction was sustained, and the price reversed lower immediately after the retest, signaling weakness in the market. This, although in itself, cannot be taken as a bearish signal as prices can always change direction.
Hence, we must wait for a break and close below the support of the BNB coin, i.e., $320. If this happens, there would be a much greater conviction for a substantial downside to the $200 area or even further if demand doesn’t pick up at the support.


