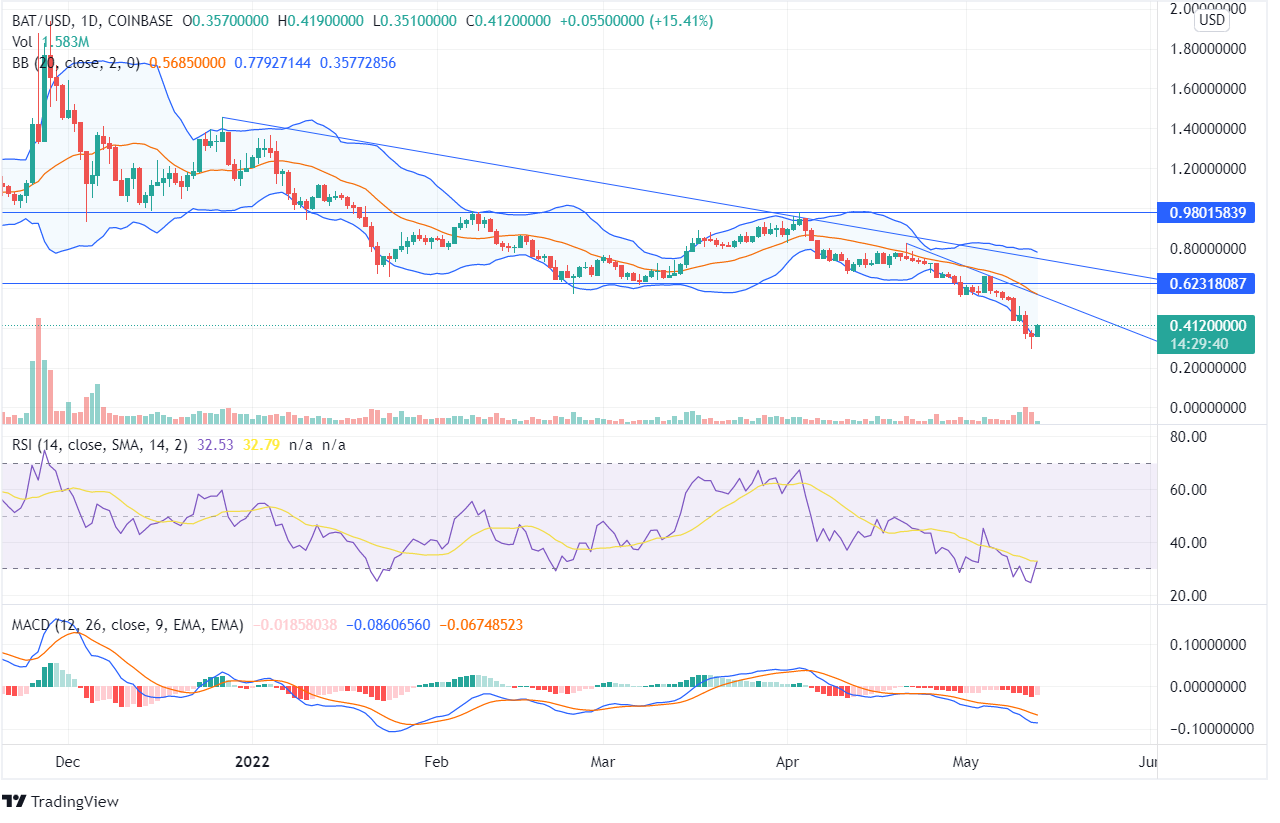
Basic Attention Token (BAT) is trailing towards lower lows with a continuous formation of bearish candles. In a period of 6 months, the token has reduced significantly from its highs of $1.766 to the current price of $0.396.
Since December, the price has been moving below the downtrend line. Once the price got tested at the trend line but faced rejection and thus declined.
The price moved between $0.980 and $0.623 in a sideways channel. However, recently on April 30, the bearish candle overpowered the bottom horizontal line, and the BAT price deteriorated.
The forming bullish candle shows that the bulls are trying to take the price upside as on the previous day, the bears tried to push the price down further but failed as the price couldn’t close near its lows.
In the 4-hour time frame chart, the BAT token shows a turnaround from the low. However, once the coin closes above the last peak of $0.510, an uptrend pattern can be expected for short-term investors.
The forming weekly candle shows a price move demonstrating that the bears tried hard to push the price downhill but were unable to close the price near its lows.
The MACD line is moving much below the Signal Line on the daily chart, and the histogram chart shows red candles for the past few days. The coin has already reduced tremendously since the MACD indicated ‘Sell Signal.’
The RSI was at its oversold zone in the past few days and is currently 32, taking a roadway towards the overbought zone. The price was moving in the lower band of Bollinger Bands. However, recently the candles rejected the price at the lower bands leading the price to the highs.
On the daily chart, supportive volume was there on May 11 for bears, but the candle formed the next day couldn’t close below the previous day’s low. There was a rejection for the further reduction of price. If the price continues to ascend, it may reach the minimum value of $0.980.


