


On March 10th, Monday the crypto market experienced another sell-off as the technology stock in the U.S. market took a major hit. As a result, the Bitcoin price plunged below $80,000, accelerating the correction momentum in the majority of altcoins including ETH. The Ethereum price faces the risk of another breakdown as its highly anticipated Pectra upgrade on the Sepolia testnet encountered an exploit, raising concerns over network security.
Key Highlights:
- Ethereum’s Pectra testnet exploit exposed a zero-token transfer loophole, causing empty block mining and raising security concerns.
- ETH price breakdown below combined support of $2,100, 200-week Exponential Moving Average and 61.8% Fibonacci Retracement Level, reinforcing downside risk
- A double top reversal pattern sets Ethereum price correction to test $1,500 floor.
Ethereum’s Pectra Upgrade on Sepolia Faces Attack
Ethereum’s latest Pectra upgrade on the Sepolia testnet was disrupted by an unknown attacker who exploited an overlooked edge case, leading to a wave of empty block mining. The attack, which took place shortly after the upgrade’s deployment on March 5, stemmed from a flaw in the deposit contract that failed to properly handle zero-token transfers.
Developers swiftly deployed a private fix to filter out these faulty transactions, avoiding public disclosure to prevent further exploits. Once 10% of network nodes were updated, full blocks resumed, and by 14:00 UTC, all nodes had implemented the final patch.
The incident, while not affecting Ethereum’s mainnet, exposed a weakness in Sepolia’s token-gated deposit contract and the ERC-20 standard’s lack of restrictions. While the exploit did not impact Ethereum’s mainnet and was limited to the Sepolia testnet, the security vulnerabilities in the Pectra upgrade could trigger short-term uncertainty or a temporary downtick.
Double-Top Pattern Points to ETH Breakdown to $1,500
In the last three weeks, the Ethereum price witnessed a notable downturn from $4,210 top to $2,000 current trading value, accounting for 52% loss. This correction marked a second reversal from the $4k region revealing the formation of a double-top reversal pattern.
The M-shaped reversal suggests intense overhead supply, which leads to a prolonged downtrend in an asset’s price. During March’s first week, the ETH price plunged below the combined support of the Double-top neckline ($2,108), 200-week EMA, and 61.8 Fibonacci retracement level.
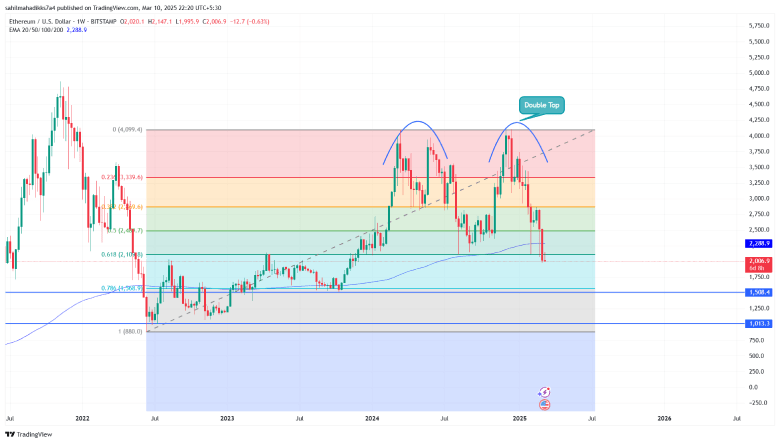
The breakdown paved the seller’s way for another 25% fall to seek support at $1,500.
Also read: Coinbase to Launch 24/7 Futures Trading in US Following SEC Case Dismissal
