


On February 21st, Friday, the crypto market witnessed a notable outflow as Bitcoin price plunged over 3%, briefly touching the $95,000 floor. The selling momentum quickly spread to the altcoin market, with top assets like Ethereum and Solana slowing a -a 4% drop. Amid this broader market downtrend, Solana (SOL) saw a significant development as Franklin Templeton officially filed an S-1 registration with the SEC for a spot Solana ETF.
Key Highlights:
- On Friday, investment management company Franklin Templeton officially filed an S-1 registration with the SEC for a spot in Solana ETF.
- A 20-day exponential moving average continues to act as dynamic resistance against SOL buyers.
- The SOL price correction struggling to follow up on the $175 support breakdown hints at the weakness in the seller’s conviction.
Franklin Files S-1 for Spot Solana (SOL) ETF
On February 21st, Franklin Templeton officially filed an S-1 registration with the U.S. Securities and Exchange Commission (SEC) for a spot Solana ($SOL) exchange-traded fund (ETF).
This move signals a growing institutional interest in Solana (SOL) as a leading blockchain asset, following in the footsteps of Bitcoin and Ethereum spot ETFs. If approved, this ETF would provide investors with direct exposure to Solana’s price movements, further legitimizing its place in the digital asset ecosystem.

Despite the news, the Solana price remained under the pressure of broader market correction and plunged 4.3% to trade at $168 currently. Consequently, the asset market cap fell to $82.15 Billion, and 24-hour trading volume wavered at $5.2 Billion.
Bear Traps Sets Solana Price For Major Reversal
For over a month, the Solana price witnessed a sharp correction trend from $295 top to $167 current trading value, registering a loss of 43%. On February 18th, the falling price gave a decisive breakdown from the $175 neckline of the double top reversal pattern.
The chart setup is characterized by an M-shaped reversal, indicating intense overhead supply. The 50-and-100-day EAM slop nearing a bearish crossover could accelerate the selling pressure in the market for prolonged correction. If the pattern holds, the post-breakdown fall could plunge the asset 33% down to hit $112 support.
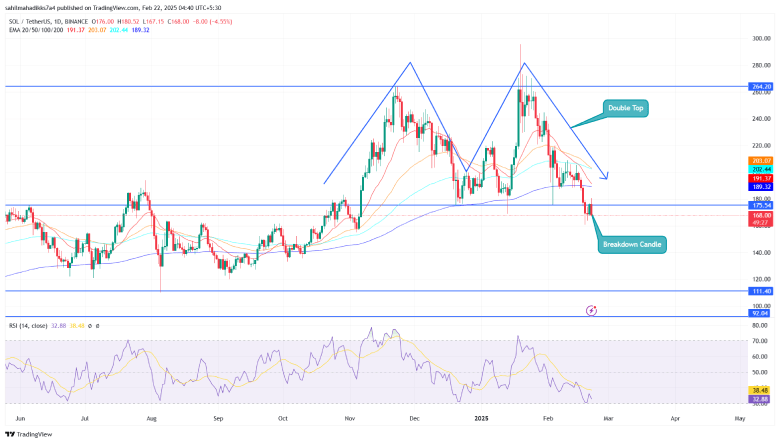
However, with broader market consolidation, the SOL price struggles to follow up this breakdown, signaling weakness in sellers’ conviction. Thus, a potential-jump above the $175 level marks the previous breakdown as a bear trap.
This failed breakdown will invalidate the bearish momentum and bolster buyers for renewed recovery.
Also Read: ByBit Revolutionizes Crypto Transparency with Real-Time Liquidation Data Disclosure
