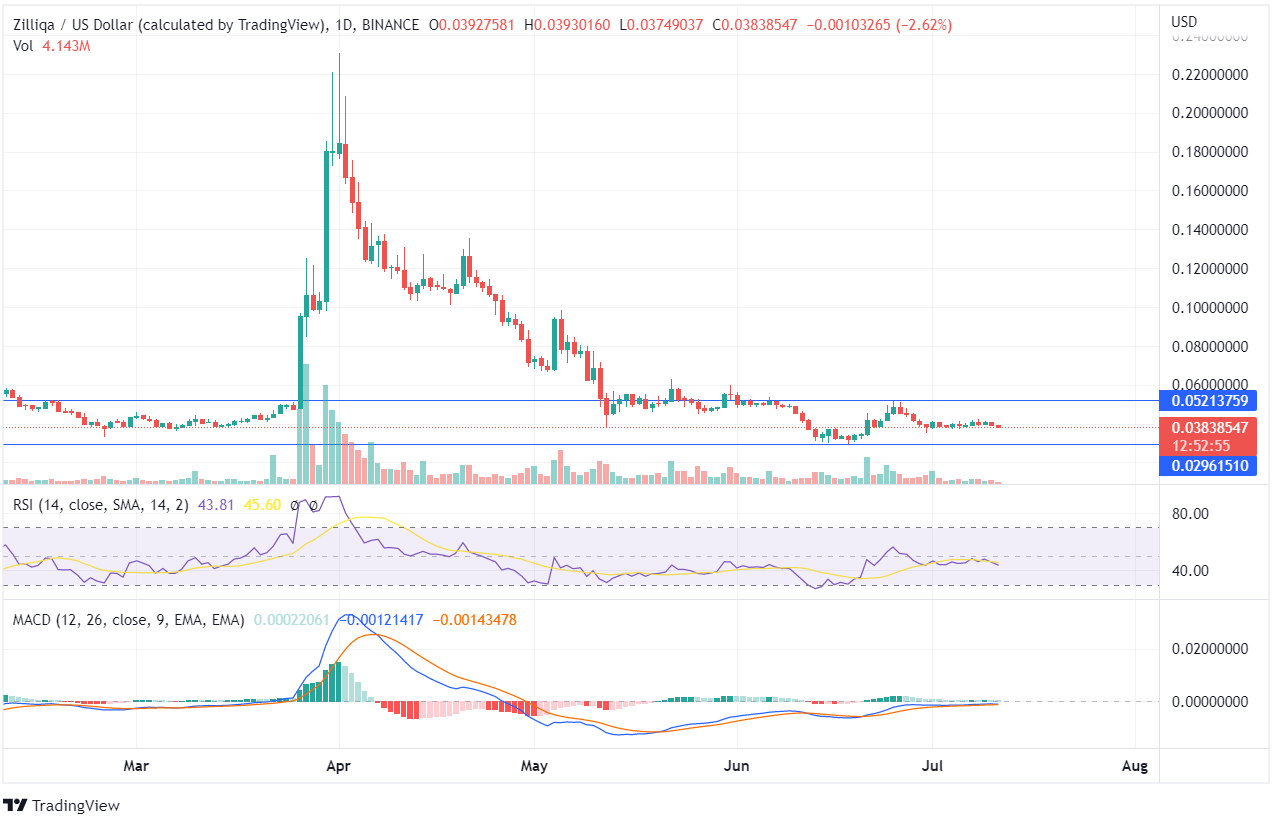
Zilliqa, with the current price of $0.03838, has been trading in a sideways channel and consolidated momentum between the value range of $0.052 and $0.029 over the past few days. The ZIL token has dropped from the highs of $0.230 and has reached its lows.
The volume bars show small price movement as neither the bulls nor the bears could push the price in any direction showing indecision in the trend. The MACD and Signal lines have overlapped, showing neutral price action. The histogram chart shows diminishing green candles forming indecision for the bulls.

The ZIL token entered the oversold zone, but the RSI is currently 43, moving sideways, showing neutral price movement. The coin has reached its 52-week low, and the price got tested multiple times at the support line of $0.0296 but failed to close below it. The ZIL price may head towards its highs if the bulls push the price upside, and once the value reaches above the recent high of $0.0521, a bullish trend can be forecasted in the long run.
The previous week’s candle shows a huge movement on the long-term chart. The candlesticks show that the price is neither able to close above the resistance point nor below the support point. Once the ZIL price moves in any favourable direction, a robust trend can be predicted.
The investors should wait for the forming candles before entering the trade as the price shows remote price movement, and the neutral indicators don’t signal any trade.

