

Zilliqa has ascended immensely during the last 2 weeks of March with significant overall returns but couldn’t cross the all-time high of $0.2563. As the ZIL token reached the high of $0.2134, it constantly began to decline and reached its lows of $0.045 in the period of 2 months.
The ZIL token is moving in the support zone of $0.050 and $0.037 on the weekly chart with the current price of $0.0525. A bullish momentum can be expected if the Zilliqa price closes above the top horizontal line of $0.062 and the last high of $0.058. The volume bar on the weekly chart shows indecisiveness between the traders as there isn’t any favorable move toward the bulls or the bears.
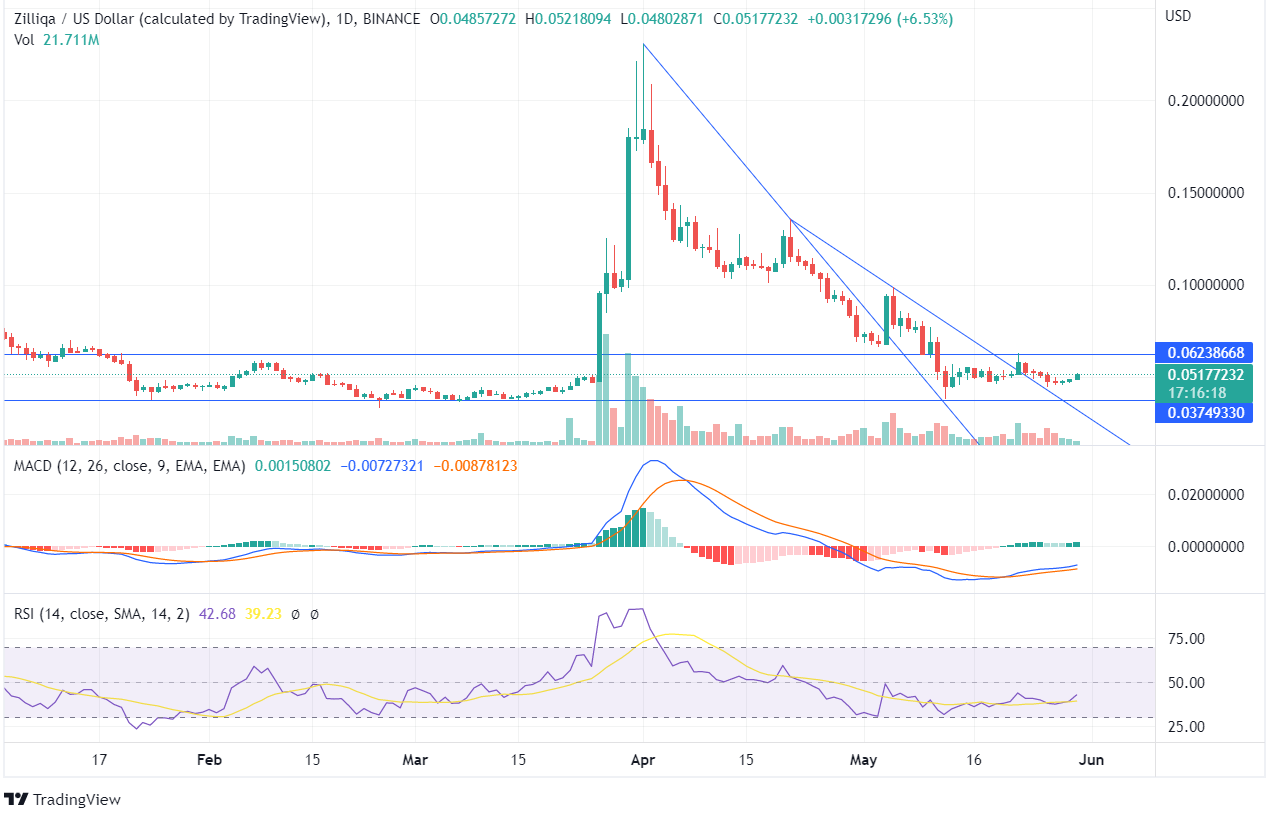
As per this Zilliqa Forecast, it is forming lower lows and lower highs on the daily chart showing a downtrend pattern. During the past few days, there have been remote price movements, and the price was moving in consolidated momentum.
The MACD Line moves above the Signal Line; simultaneously, the histogram chart also shows green candles indicating bullish momentum. Though the MACD indicator gave a bullish sign on May 22, the ZIL price couldn’t rise after that and has been moving sideways. The RSI being 42 is currently in the neutral zone as there isn’t any robust price action.
In the current scenario, the traders should wait for the forming candles as the price showing an inaccessible move doesn’t clearly forecast the future price trend.