

XRP reflects range-bound trading from the past few months. There has been a continuous fall in the price from the past few days and the coin is moving with downward momentum. The technical parameters are indicating an upcoming bearish momentum which may take the coin to its support line of $0.51, aligning with many XRP price prediction models.
 XRP has been straggling towards its support zone with the current price of $0.75. In the last two months, the coin has marked considerable fall. The XRP coin price is moving beneath the down trend line stretching over from November. On December 23, 2021, the price got tested at the trend line but failed to suppress the trend line and uplift. On January 03, 2022, there was a formation of the bearish engulfing pattern, after which the coin declined massively in three days.
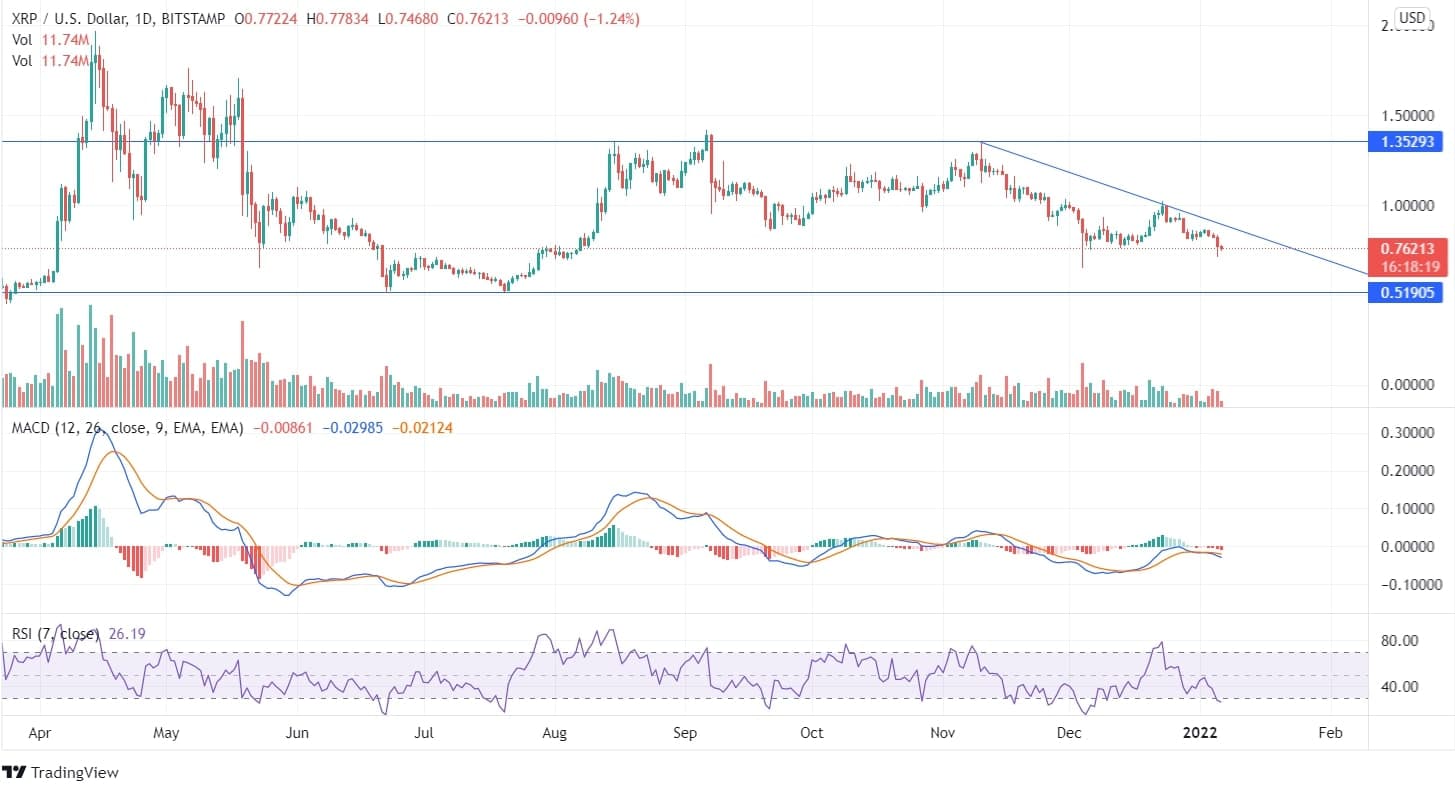
On the daily chart, the MACD line is below the signal line and the histogram chart also represents red candles. The RSI being at 28 has just entered the oversold zone. This can be an opportunity for the bears. The volume bar is also representing a bearish price action. Investors and traders should get more information about the future trend of the cryptocurrency to avoid unnecessary losses.
On the weekly chart, the XRP price is trailing down at the edges of the down trendline. The indicators are also indicating a downward momentum to the minimum target of $0.51.