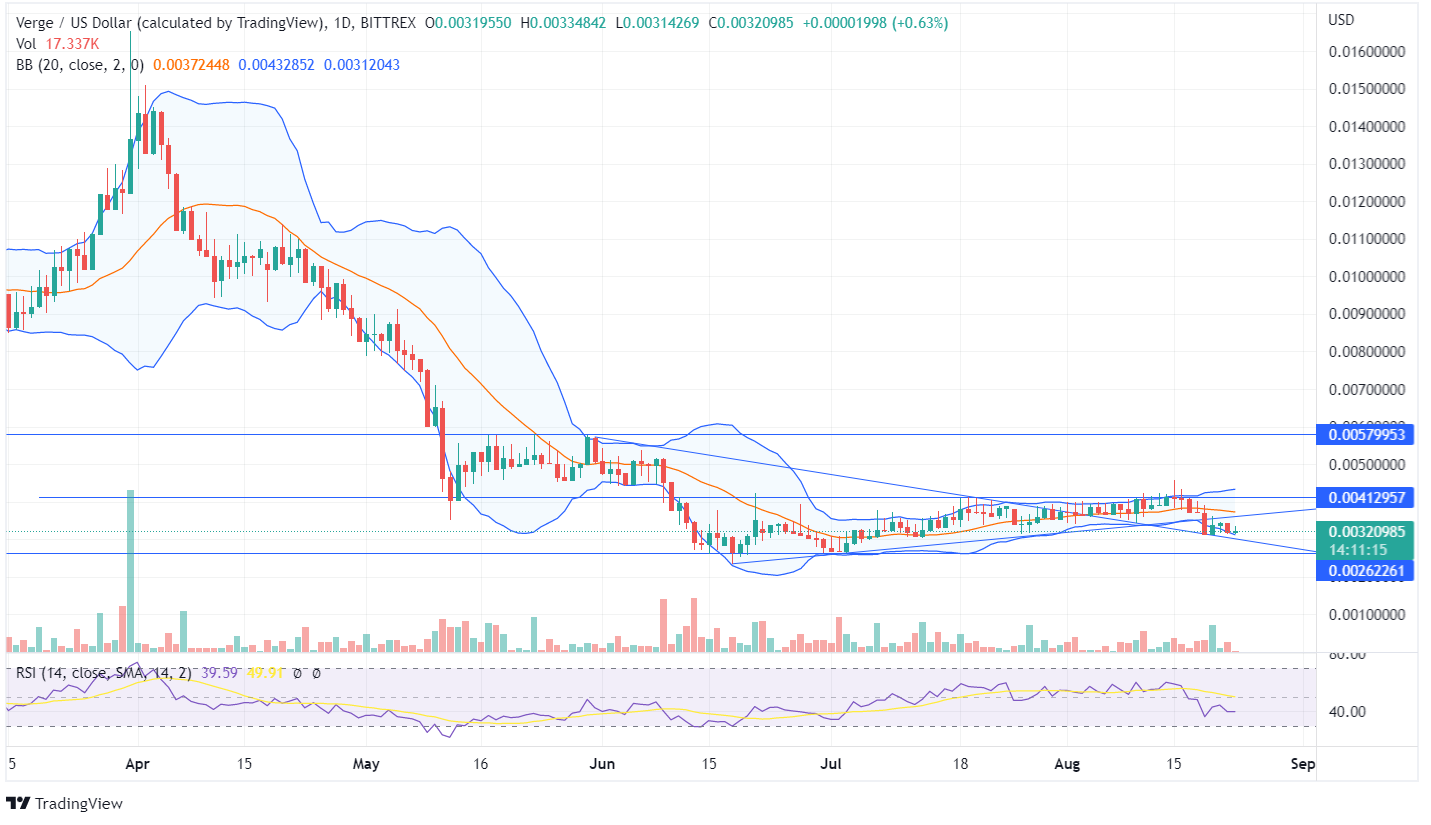
Verge (XVG) is moving in consolidated momentum as the price moves in a sideways channel between a price range. The XVG token shows a current market price of $0.0032 after facing rejection for an up move. The Verge price moving sideways shows that neither the bulls nor the bears actively push the price in any direction.
The XVG prices are neither closing above the previous highs nor below the previous lows, thus forming indecision for the traders, similar to the price action of the XVG coin in July. The candles recently traversed the up-trend line on the daily chart and may head towards the support line of $0.0026. The daily bearish candle formed on the previous day shows a marginal decline in the Verge price.
The volume bars moving below average show that both bulls and bears need additional traders for a supportive volume. The RSI being 39 shows neutral price movement as the price moves sideways; the indicator line also shows sideways movement. The Verge price is moving at the edges of the lower band of Bollinger Bands. The Bollinger Bands being close to each other shows low volatility in the market, and the XVG price may move in a downtrend pattern.
The previous week’s bearish candle suppressed the trend line with immense pressure, with a huge decline. The forming bearish candle shows a further downfall as the price moves below the previous candle’s low. The price is revolving at the lower zone and may continue to fall towards its lower lows as there is selling pressure by the bearish traders.


