

Bitcoin is making moves for a retest of $60,000. The latest technical analysis, paired with the on-chain metrics that provide clarity, suggests a bull run that can drive Bitcoin beyond its vital psychological resistance point.
Technical Indicators: Forming an ascending triangle pattern
Recently, in price action, the Bitcoin chart has shown an ascending triangle pattern. Ascending Triangle — BullishThe ascending triangle is a bullish breakout pattern that occurs when there are higher lows at the horizontal resistance line. As of August 8, the price of Bitcoin is about $57,530, and the Fibonacci retracement acts as a principal resistance line. Presently, the critical support level is $56,995.3 based on 0.786 Fibonacci Retracement [RHS of the chart below].
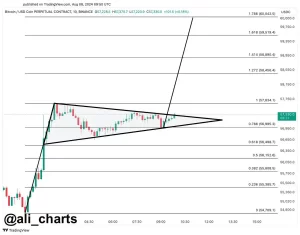
Ascending triangles represent consolidation before an asset price breaks out of the upward trajectory of its previous move. However, the breakout indicates a target of $60,042.5 for this move, as determined by the triangle’s height. This is in line with the 1.786 Fibonacci extension level and further confirms a bullish scenario.
The Cat’s Out of the Bag — Decrease In Liquidity
Crucial on-chain metrics backing up this technical view are those of Bitcoin sending addresses. According to data provided by Glassnode, from August 1 to August 8, there was a significant drop in the number of sending addresses. When sending addresses decline, it is an important indicator as a shrinking number of sending addresses commonly foreshadows decreased selling pressure. Conversely, a decrease in the number of unique addresses sending Bitcoin suggests a reduction in the willingness of holders to sell in bulk, which is typically a bullish indication.
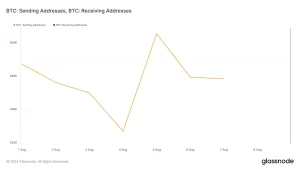
Moreover, what this chart shows is a downtrend of sending addresses between 8/5 and now, starting from $506k, dropping down sharply, and then stabilizing at around 450k, which hints at the growing propensity for accumulation vs. distribution (i.e., more Bitcoin being held in different wallets instead of moving). The initial drop-off in sending addresses may indicate that selling pressure is easing up. Less than unique addresses are sending Bitcoin, which means that holders may be keeping their stash, expecting the price to go higher. The sharp spike on August 4 could have been caused by a brief increase in liquidity, possibly due to external events or releases.
So, Is Bitcoin reaching the $60k mark?
Based on BTC forecasts, technical analysis, and on-chain signals, Bitcoin could reach as high as $60K.We expect the breakout to be on top of this level, considering both the descending sending addresses and the ascending triangle pattern. Meanwhile, the overall cryptocurrency market appears bullish due to institutional demand and macroeconomic conditions, which also help this view. However, traders and investors should monitor key levels, particularly the critical stop loss at $56,870, before any investment.