

Litecoin has been stranded around $49 for the longest time now and has been facing a strict rejection and resistance at $50 over the past three months now. The on-chain analysis of LTC exhibits a mix of signals that the coin has been giving cumulatively in comparison to the traditional price analysis, which otherwise would be left unheard.
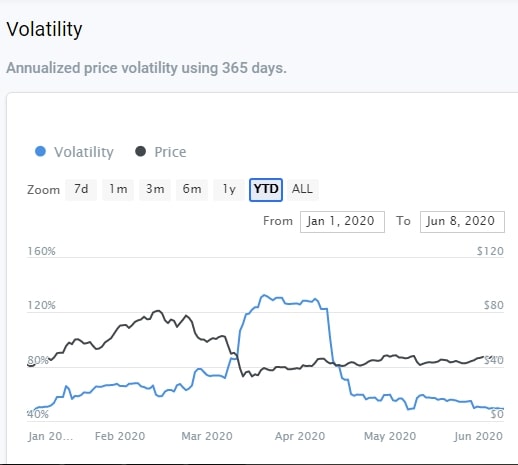
Volatility has been the major factor during this time of the Pandemic when the major markets crashed, and the investors opted for short selling in place of holding or investing even more. With liquidity being the important highlight of economic standstill due to lockdown, many traditional investments faced utter selling pressure, including the safe-haven–Gold and the loonie linked commodity—Oil. However, as per the YTD performance of LTC against USD is holding compact volatility, which happens to 59.19% from 30-day high marked at $47, and on the flip side, it is 48.91% from the marked 30-day low.
Moreover, if we dig deeper, the on-chain analysis metrics gives analytical information about the amount each address holds, the time for which the amount is held by any particular address, volume, trading behavior, Unspent transaction output since the time received, block height, weight, actual size in bytes of Bothe the blockchain and individual block.
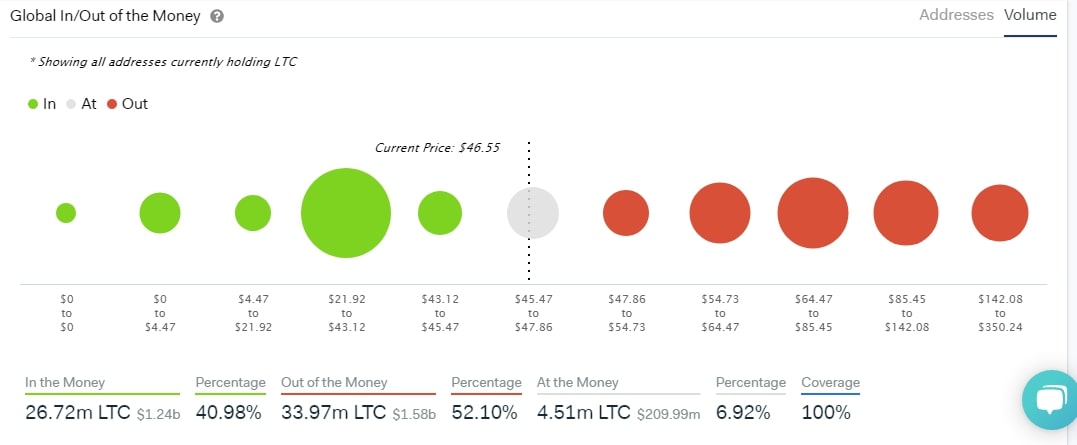
Additionally, the volume of LTC held, according to In the Money (ITM), Out the Money (OTM), and ATM (ATM) has been quite interesting based on the price range. It is as follows:
The majority of the address have been holding an In the Money option between the price range of $21.92 to $43.12 while the current price of Litecoin is marked around $46.55. A call option can be exercised as the market price is above the strike price for the majority of ITM addresses. However, the percentage comparison of ITM and OTM happens to be favoring the latter wherein almost equally distributed addresses have a put option in an exercise wherein the strike price is higher than the market price.
Things you probably didn't know about #Litecoin:
🔸 Litecoin modified the original #Bitcoin protocol.
🔸 Privacy features are in the works.
🔸 According to @intotheblock, $LTC has a 0.71 price correlation with $BTC.Read more with #BinanceResearch. ⬇️https://t.co/VJfXifnxOk
— Binance (@binance) June 5, 2020
Well, the hidden insights and the technical correlations always point about how much correlated any altcoin with that of Bitcoin is. As per the above tweet with regard to intotheblock, Litecoin has 0.71 correlation with of Bitcoin, which means it is positively correlated to the king of cryptos and, therefore, may reflect influential price movement. In common parlance, there is enough correlation between the two variables to fluctuate together.

On the other hand, if we look into the traditional price analysis of Litecoin against the US Dollar, we see that the coin is holding slight support from 50-day and 200-day MA while lacks support from 200-day MA. Over the past 30 days now, LTC is holding a flattish trend with mild intraday volatility and a strict rejection at $80. While taking a glance at the YTD chart, the coin is lacking steady traction and is not one of the alts that have recorded amazing recovery after the previous week’s crash.
The technicals also confirm the flat yet a bearish crossover due to mere intraday pullbacks. The MACD appears flat and bearish while the RSI lies at 51.72. As per LTC price prediction, many analysts & experts suggested investing to make huge profits. If you want to invest or trade in cryptocurrency to make good profit then thetrading212.com is one of the best platforms. It is a platform that makes you earn good profit from Bitcoin & other cryptocurrencies.